

OT Cybersecurity Lab
Build a Physical OT Cybersecurity Lab at Home: OpenPLC, Modbus, ScadaBR & Kali
Learning OT cybersecurity at home comes with one obvious challenge: OT is physical.
If you are learning traditional IT or cybersecurity, a large part of the environment can be virtualized. You can create servers, clients, firewalls and entire networks using virtual machines.
OT can also be simulated to a large extent. We can simulate PLCs, sensor values, HMIs and even complete industrial processes. Tools such as OpenPLC and Factory I/O make this quite easy.
But somehow, I was still missing the physical part of OT.
I wanted to press an actual pushbutton and see a PLC input change. I wanted the PLC logic to operate a real relay. At the same time, I wanted to capture the Modbus traffic in Wireshark and see what happens if another machine on the network tries to manipulate that communication.
So I decided to build a small physical OT cybersecurity lab at home.
And surprisingly, it didn’t cost much.
Why I Built a Physical OT Lab
My first setup was completely virtual.
I experimented with OpenPLC and Factory I/O. It was useful for understanding PLC programming and process simulation, but my main interest was OT cybersecurity. I wanted to spend more time looking at the actual network communication between industrial devices.
I then created another lab using OpenPLC and ScadaBR.
This was much closer to what I wanted. OpenPLC acted as the controller, ScadaBR acted as the SCADA/HMI, and I could capture the Modbus TCP communication between them using Wireshark.
For example, Modbus TCP communication could easily be identified on: TCP Port 502
That was useful for understanding the protocol and looking at Modbus requests and responses.
But I still wanted something physical.
I wanted this: Physical Pushbutton → PLC → Modbus TCP → Scada
And at the same time, I wanted another machine on the network from which I could test what happens when Modbus commands are sent directly to the PLC.
That led to the lab described in this post.
The Hardware
I didn’t want to spend too much money initially on an industrial PLC just for experimenting.
Instead, I bought a Raspberry Pi Zero 2 W and installed OpenPLC Runtime on it.
The Raspberry Pi is obviously not a replacement for an industrial PLC. But running OpenPLC on it gives me a low-cost physical PLC-like controller with GPIO pins that I can connect to real inputs and outputs.
For this lab, I used:
| Component | Approx. Cost |
|---|---|
| Raspberry Pi Zero 2 W | ₹1,500 |
| Pushbuttons | ₹50 |
| Jumper wires | ₹50 |
| Breadboard | ₹150 |
| Resistors | ₹150 |
| 2 × USB-to-Ethernet adapters | ₹1,200 |
| 4 Channel Relay Module | ₹100 |
I already had some other components such as a managed Ethernet switch.
Not every component I purchased is used in this particular experiment. I plan to expand the same lab gradually rather than build everything at once.
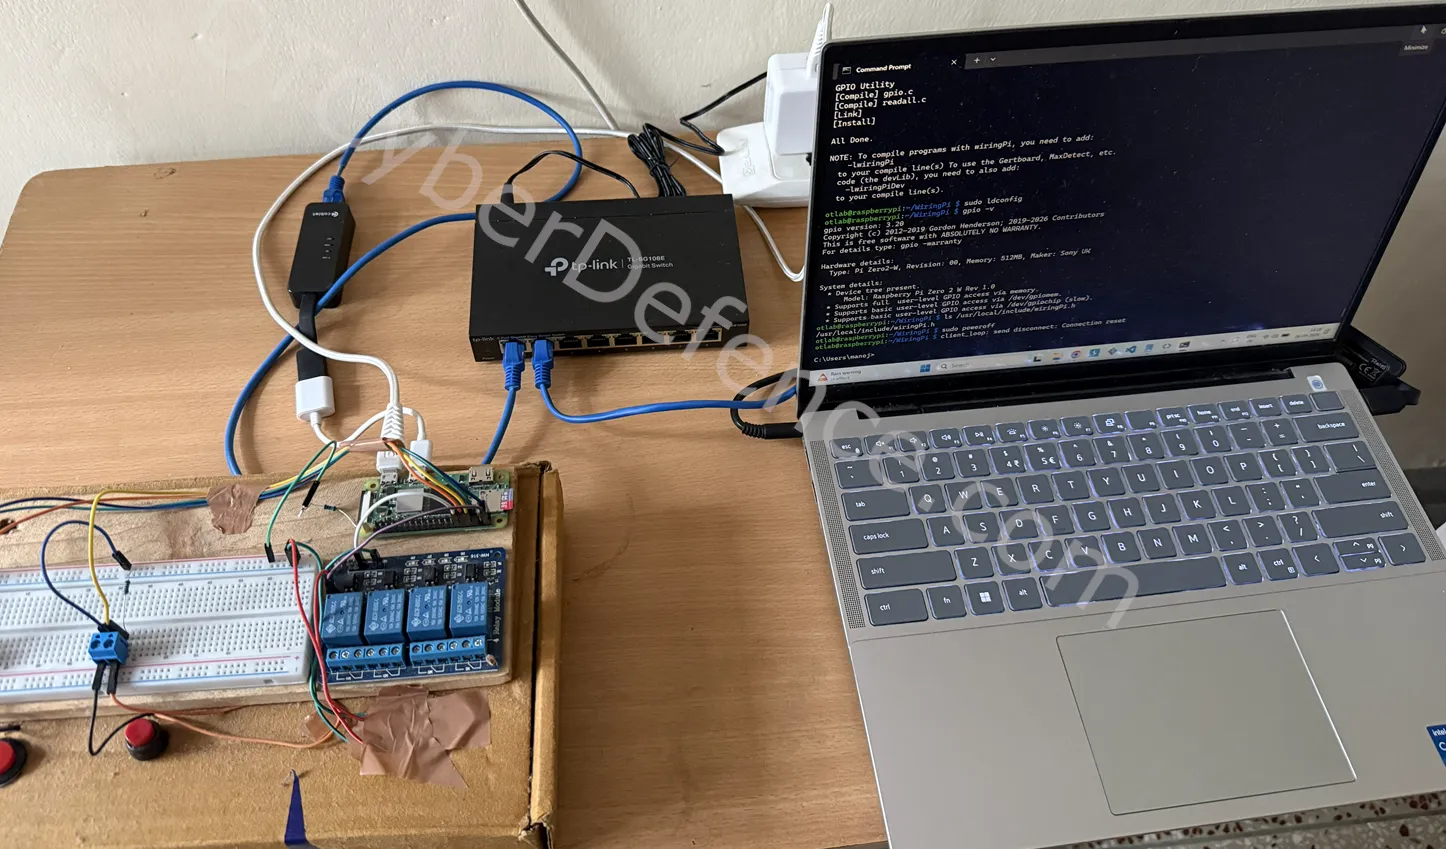
Figure 1: Picture of OT LAB to be Built in this post
Lab Network Architecture
For the first version of the lab, I deliberately kept the network simple.
Everything is on the same subnet:192.168.137.0/24
My devices are:
| Device | Address | Role |
|---|---|---|
| Windows laptop | 192.168.137.1 |
Engineering workstation / VirtualBox host |
| Raspberry Pi/OpenPLC | 192.168.137.2 |
PLC |
| ScadaBR VM | 192.168.137.3 |
SCADA/HMI |
| Kali Linux VM | 192.168.137.190 |
Security testing machine |
Both ScadaBR and Kali are running as virtual machines, but their network adapters are configured in Bridged Adapter mode.
This means they appear as separate hosts on the same OT network rather than sitting behind VirtualBox NAT.
Conceptually, the network looks like this:
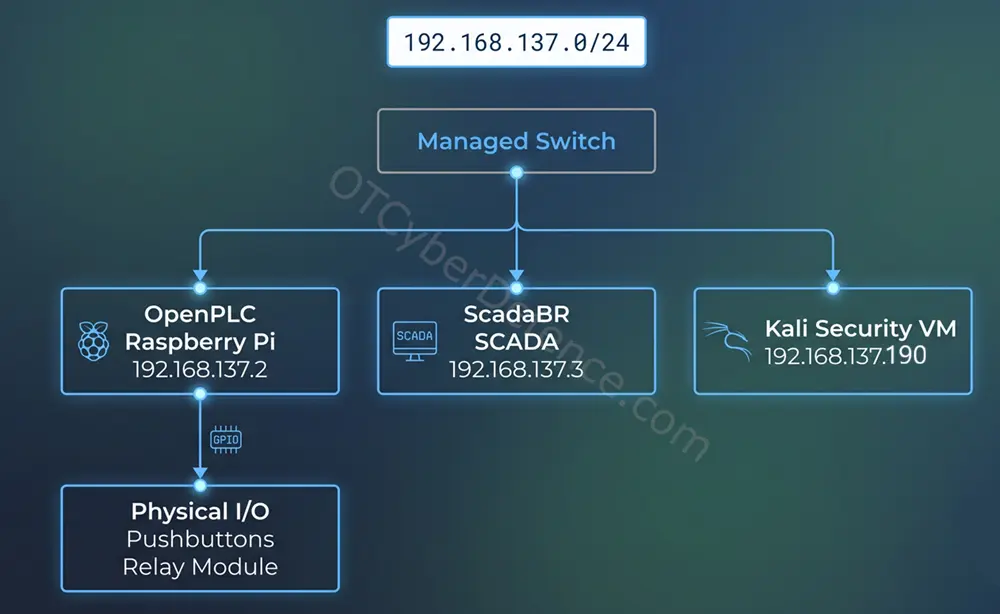
Figure 2: Simplified Network Architecture of the Lab
This is intentionally a flat network.
There is currently no firewall or segmentation between the SCADA system, security workstation and PLC.
That is something I will change in a future version of the lab. For now, I actually want this insecure architecture because it makes it easier to understand Modbus communication and demonstrate why an unsegmented OT network can become a problem.
1. Installing Raspberry Pi OS
The first step is installing Raspberry Pi OS on the Pi.
I won’t cover the complete Raspberry Pi OS installation here because the Raspberry Pi documentation already explains it well.
One thing worth mentioning about my setup is that I am using the Pi headless.
There is no monitor or keyboard connected to it. I access it using SSH from my Windows laptop.
I am also not using the Pi’s Wi-Fi for this lab. The Pi is connected through Ethernet.
My laptop has internet over Wi-Fi, and during installation I shared the laptop’s internet connection with the Ethernet network.
After configuring the network, my Pi was available at: 192.168.137.2
2. Installing OpenPLC Runtime on Raspberry Pi
Next, I installed OpenPLC Runtime.
First update the Pi:
sudo apt update
sudo apt upgrade -y
Install Git:
sudo apt install git -yThen download OpenPLC Runtime:
cd ~

git clone https://github.com/thiagoralves/OpenPLC_v3.git

cd OpenPLC_v3
For Raspberry Pi, install it using:
./install.sh rpiBe patient here.
On my Raspberry Pi Zero 2 W, the installation took more than 45 minutes.
Once installation completes:
sudo rebootAfter the Pi comes back online:
hostname -IIn my case:
192.168.137.2I could then access OpenPLC Runtime from my Windows browser at:
http://192.168.137.2:8080The default credentials were:
Username: openplc, Password: openplc
After logging in, I selected:
Hardware → Raspberry Pi
and saved the configuration.
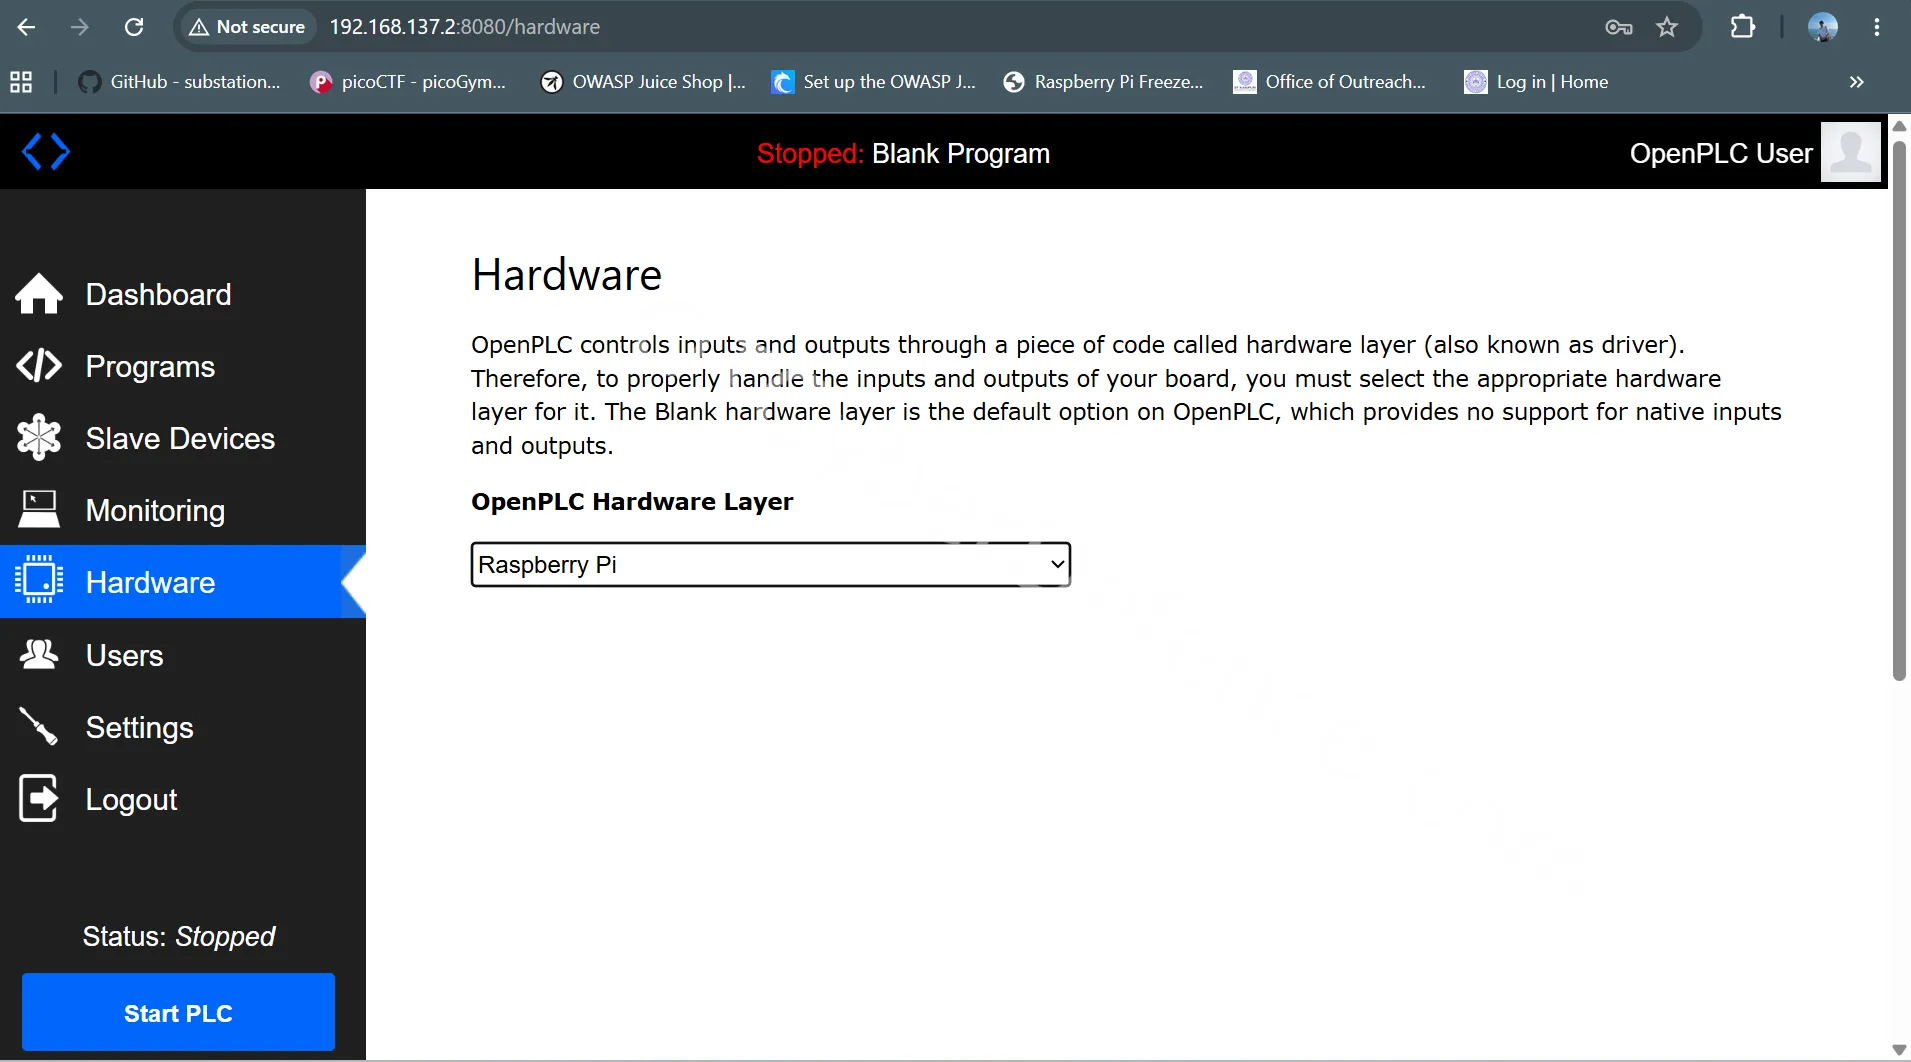
Figure 3: Openplc Hardware Configuration
A problem I encountered: WiringPi
When I initially selected the Raspberry Pi hardware layer, OpenPLC failed to compile with: “fatal error: wiringPi.h: No such file or directory”
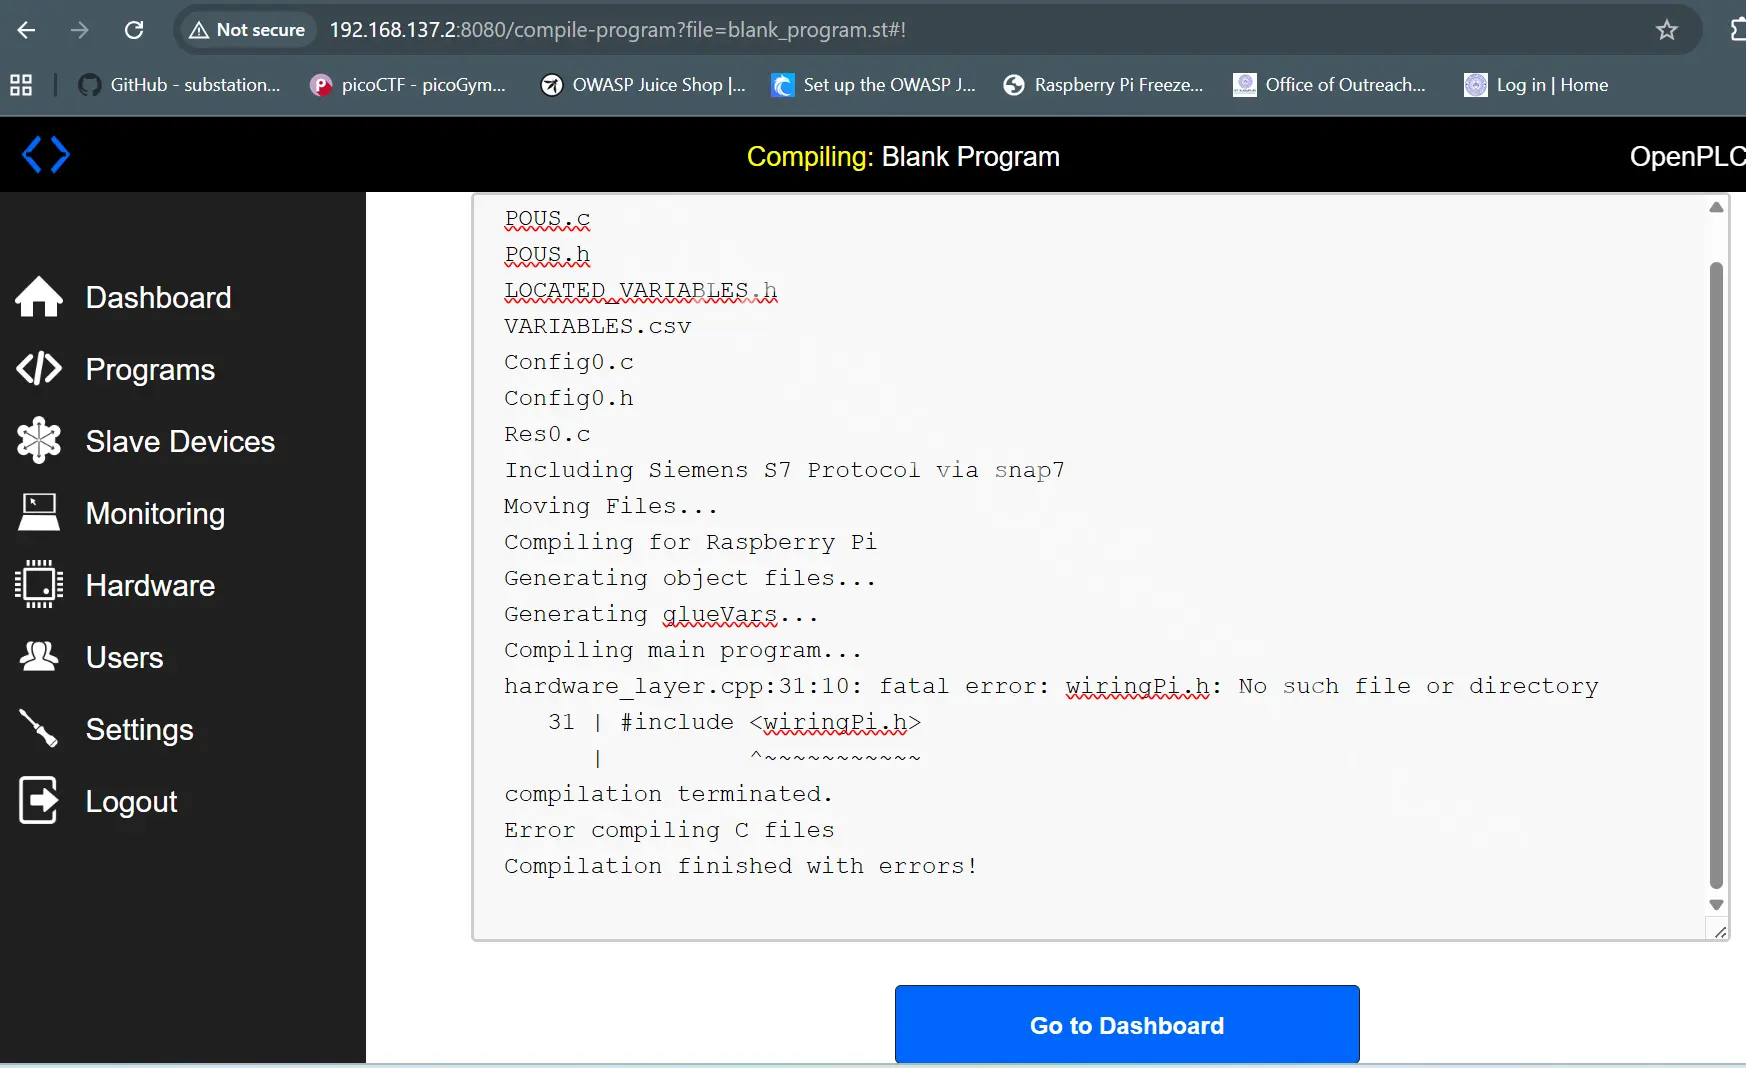
Figure 4: Error During Changing Hardware Configuration
In my case, WiringPi wasn’t installed correctly. The current WiringPi project recommends building/installing it from source.
After installing WiringPi from source and verifying that: gpio -v worked, OpenPLC was able to compile the Raspberry Pi hardware layer.
This is worth checking if you encounter the same error.
3. Installing ScadaBR
For SCADA, I am using ScadaBR inside VirtualBox.
Instead of using VirtualBox NAT, I configured its network adapter as: “Attached to: Bridged Adapter” and selected the laptop Ethernet adapter connected to my OT network (Realtek USB in my case).
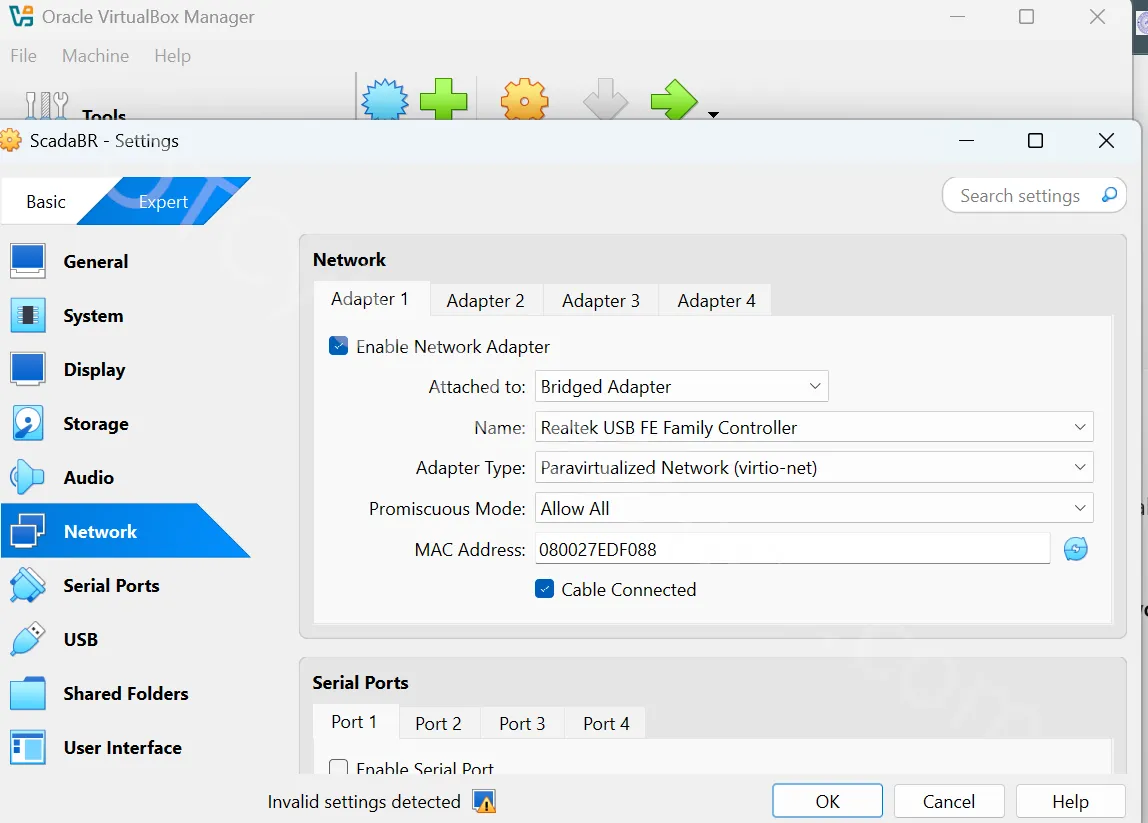
Figure 5: VirtualBox ScadaBR Bridged Adapter configuration
I configured ScadaBR with the static address: 192.168.137.3/24
I could then verify communication with OpenPLC: using ping 192.168.137.2.
4. Setting Up Kali Linux
I also installed Kali Linux as another VirtualBox VM.
Again, I selected: “Bridged Adapter” and bridged it to the same Ethernet interface.
I assigned Kali: 192.168.137.190.
Now I had three logical OT devices:
OpenPLC  → 192.168.137.2
ScadaBR  → 192.168.137.3
Kali     → 192.168.137.190
All three could communicate directly.
Later, Kali will be used to send Modbus requests to OpenPLC.
5. Creating the PLC Program
I used OpenPLC Editor on Windows to create the PLC program.
The program is intentionally very simple.
I don’t want the PLC logic itself to become the focus of this experiment. The objective is to understand the complete path from physical I/O to PLC logic, SCADA communication, packet capture and finally Modbus manipulation.
My program uses two physical inputs: Start/Stop & Emergency Stop pushbuttons and one output: Motor (which is indicated by relay output pin).
The logic checks the state of the Start/Stop and Emergency Stop inputs before operating the motor output.
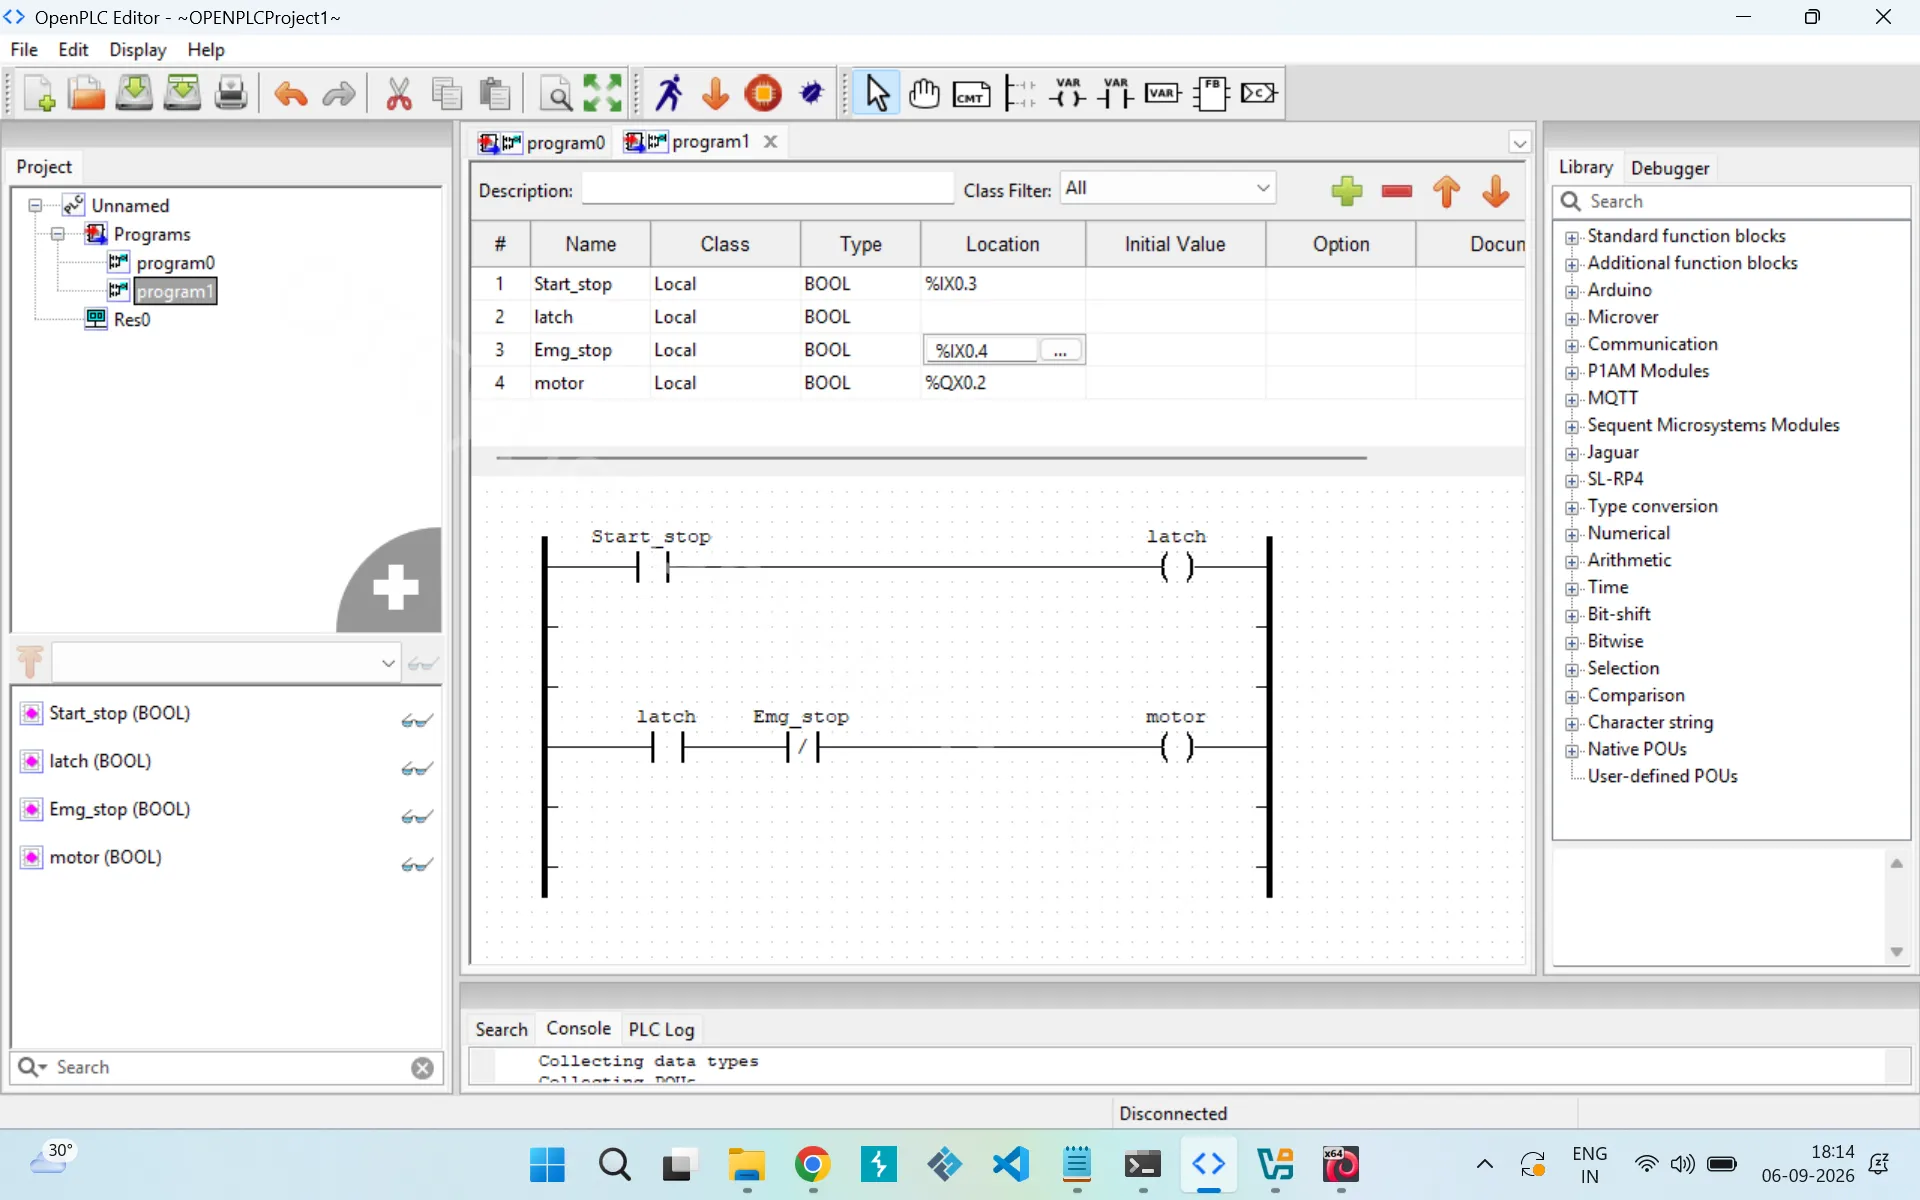
Figure 6: Ladder logic program in OpenPLC Editor
For my wiring I used:
Start/Stop → %IX0.3
E-Stop     → %IX0.4
Motor      → %QX0.0
After creating the program, save this program as .st file using a ‘down arrow’ button as seen on OpenPlc as shown in below picture.

Figure 7: Generate Program for Openplc Runtime Button
6. Understanding OpenPLC GPIO Mapping
This part initially confused me.
OpenPLC addresses, Raspberry Pi BCM GPIO numbers and physical header pin numbers are three different things.
For the pins used in my lab:
| OpenPLC | BCM GPIO | Physical Pin Function |
|---|---|---|
%IX0.3 |
GPIO17 | Pin 11 Start/Stop |
%IX0.4 |
GPIO27 | Pin 13 Emergency Stop |
%QX0.0 |
GPIO14 | Pin 8 Relay/Motor |
You can check your GPIO pin status and mapping using: gpio readall.
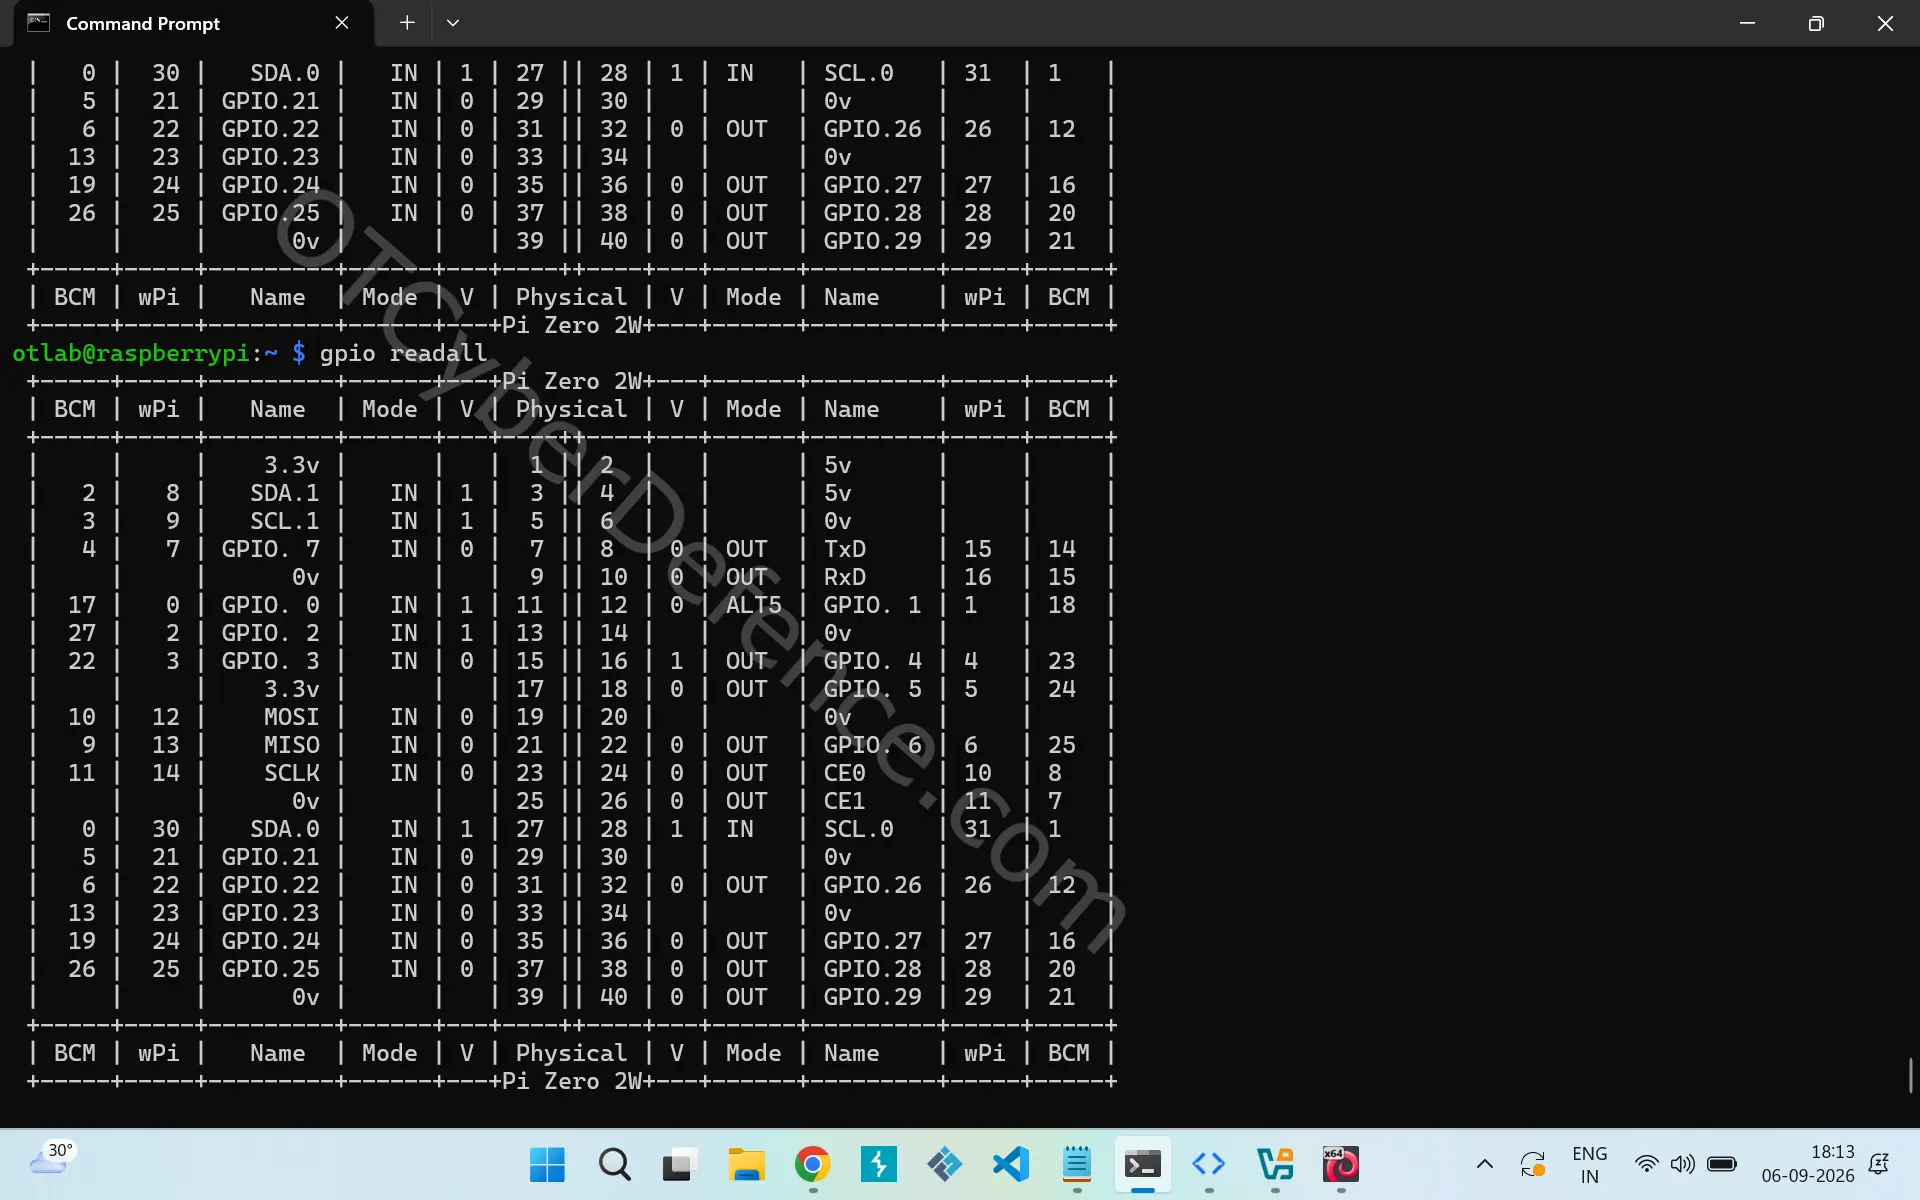
Figure 8: Screenshot of gpio readall
When building your own lab, don’t assume that an OpenPLC address such as
%IX0.3 means GPIO3 or physical pin 3. Always verify the mapping.
7. Wiring the Physical Inputs
For the Start/Stop pushbutton, my wiring was:
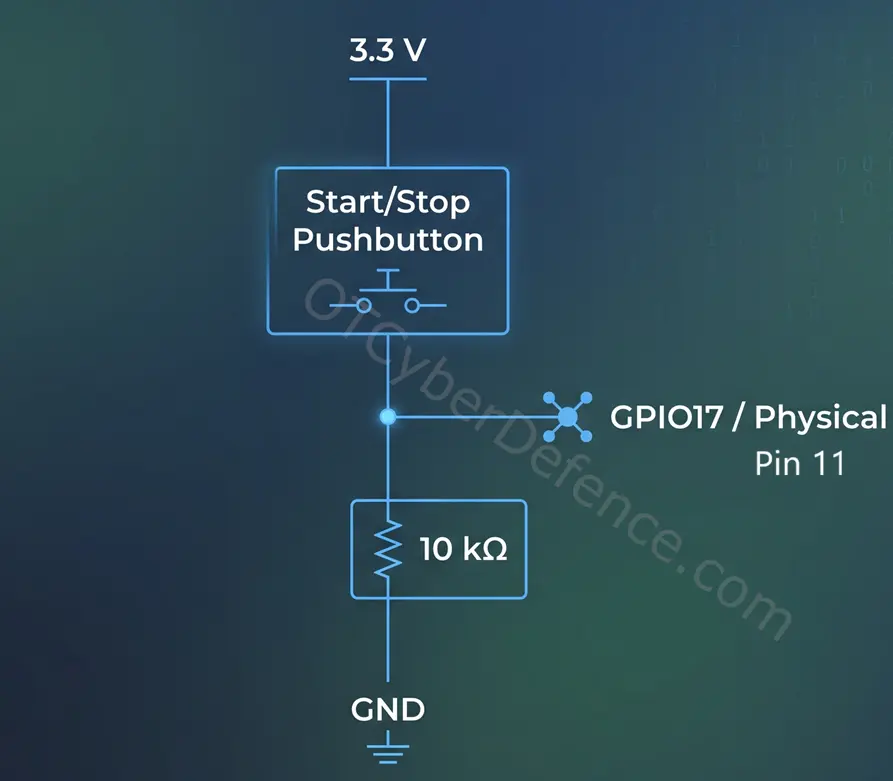
Figure 9: Wiring Diagram for Start_stop Switch
The 10 kΩ resistor acts as a pull-down resistor.
When the button isn’t pressed, the GPIO is pulled toward ground.
When I press the button, 3.3 V is applied to the GPIO and the PLC sees the input change.
I used a similar arrangement for the second input:
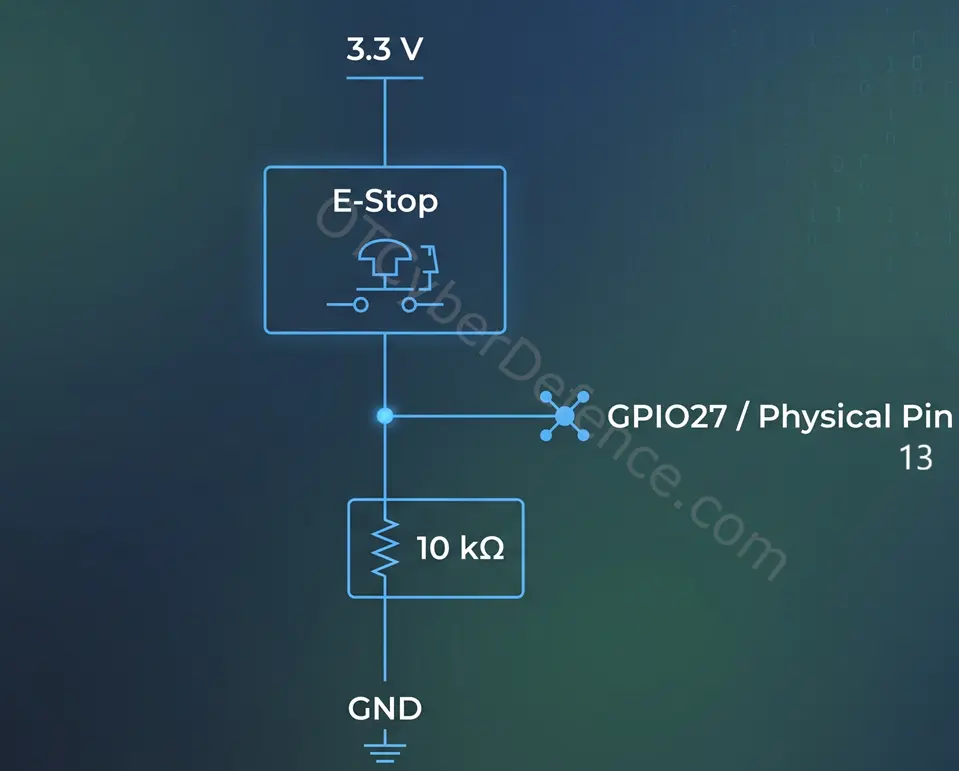
Figure 10: Wiring Diagram for Emergency Stop Switch
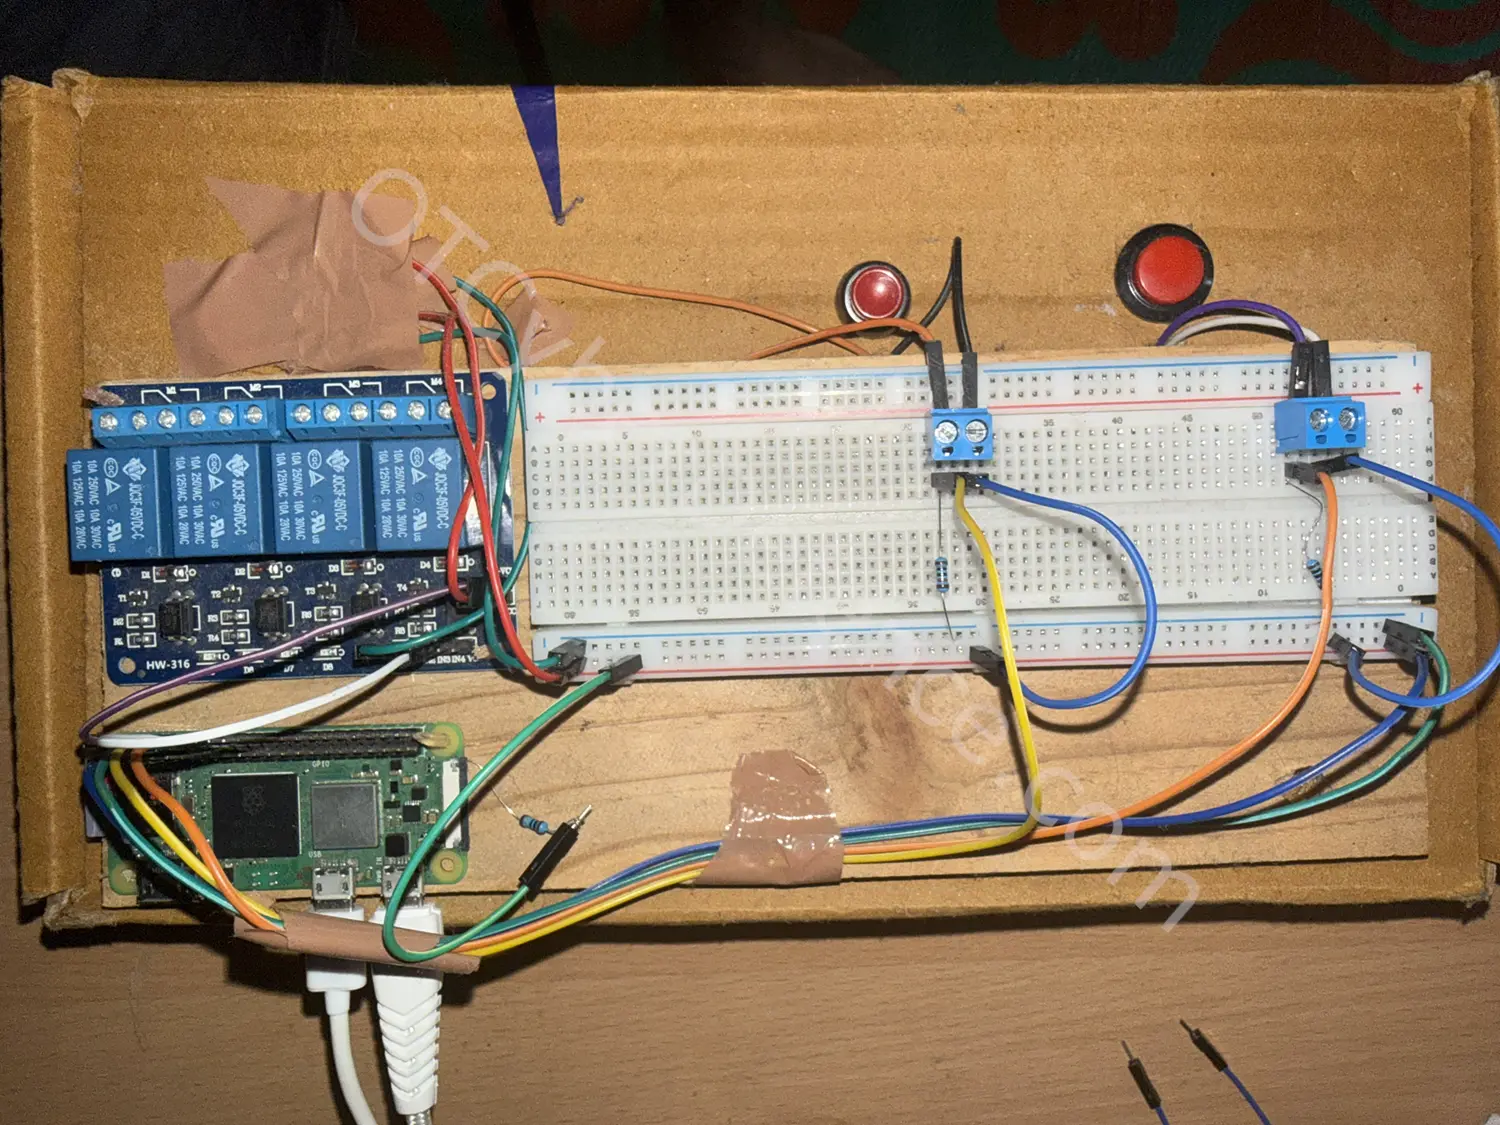
Figure 11: Top View of Breadboard Circuit
8. Connecting the Relay Output
For the output I used an opto-isolated relay module.
My module had separate JD-VCC and VCC connections, so I connected:
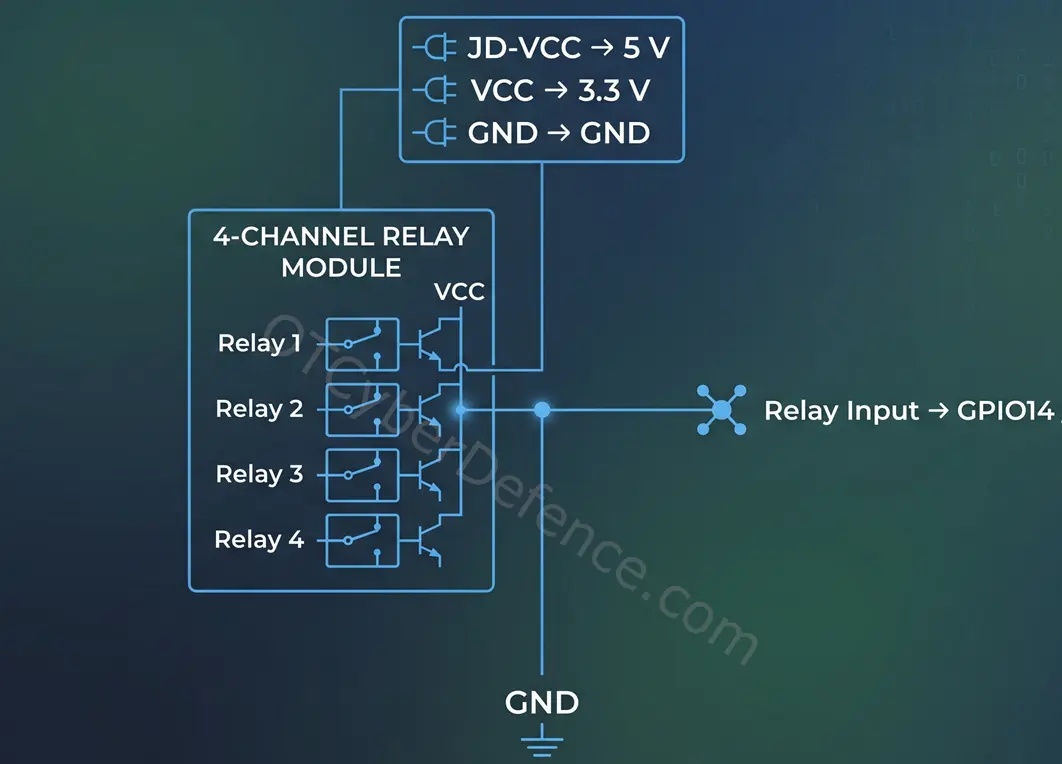
Figure 12: 4 Channel Relay Wiring
One thing I noticed during testing was that my relay module uses active-low inputs.
This means the relay behaviour can appear inverted compared with the PLC Boolean value.
For example, depending on the module:
GPIO LOW  → Relay ON
GPIO HIGH → Relay OFF
This initially looked like my PLC logic was wrong, but it was simply the electrical behaviour of the relay board.
9. Uploading and Testing the PLC Program
With the wiring complete, I opened OpenPLC Runtime: 192.168.137.2:8080
I uploaded the program generated from OpenPLC Editor and started the PLC.
The Monitoring page is very useful at this point.
Initially I could see the input and output states.
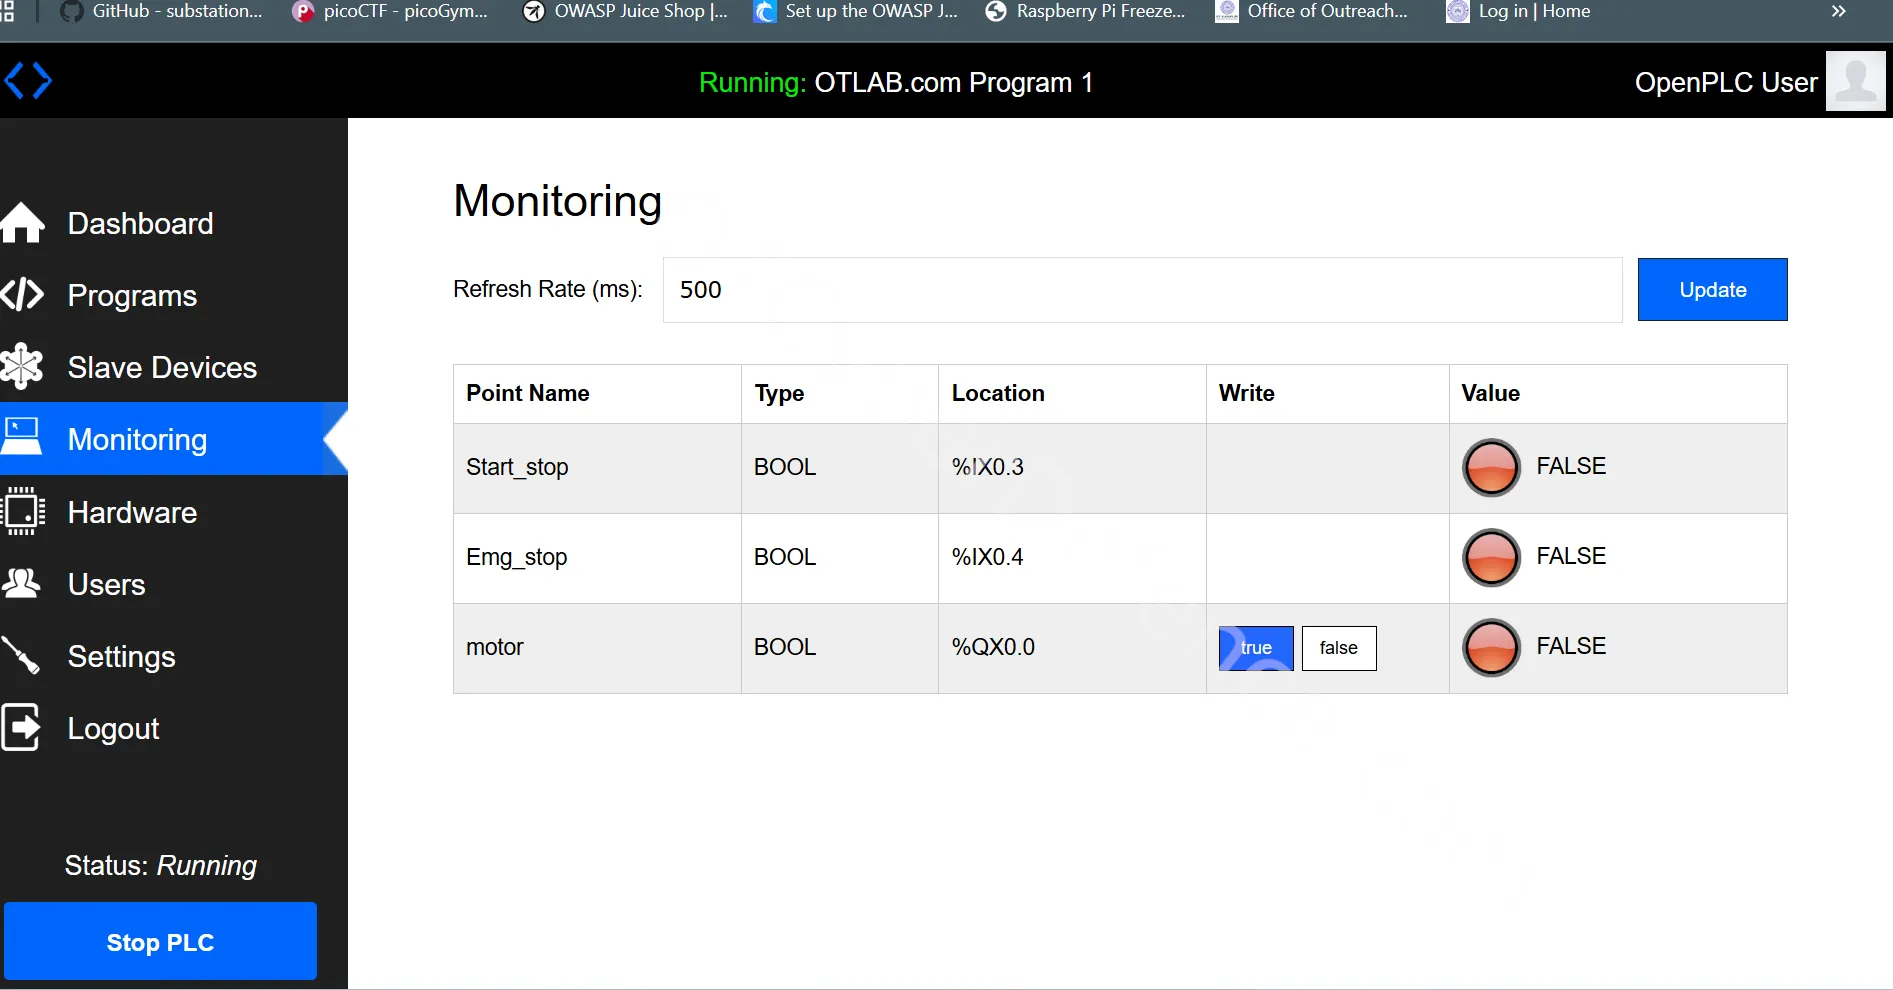
Figure 13: OpenPLC Monitoring page – normal state
Then I physically pressed the Start/Stop button.
The corresponding input changed in OpenPLC.
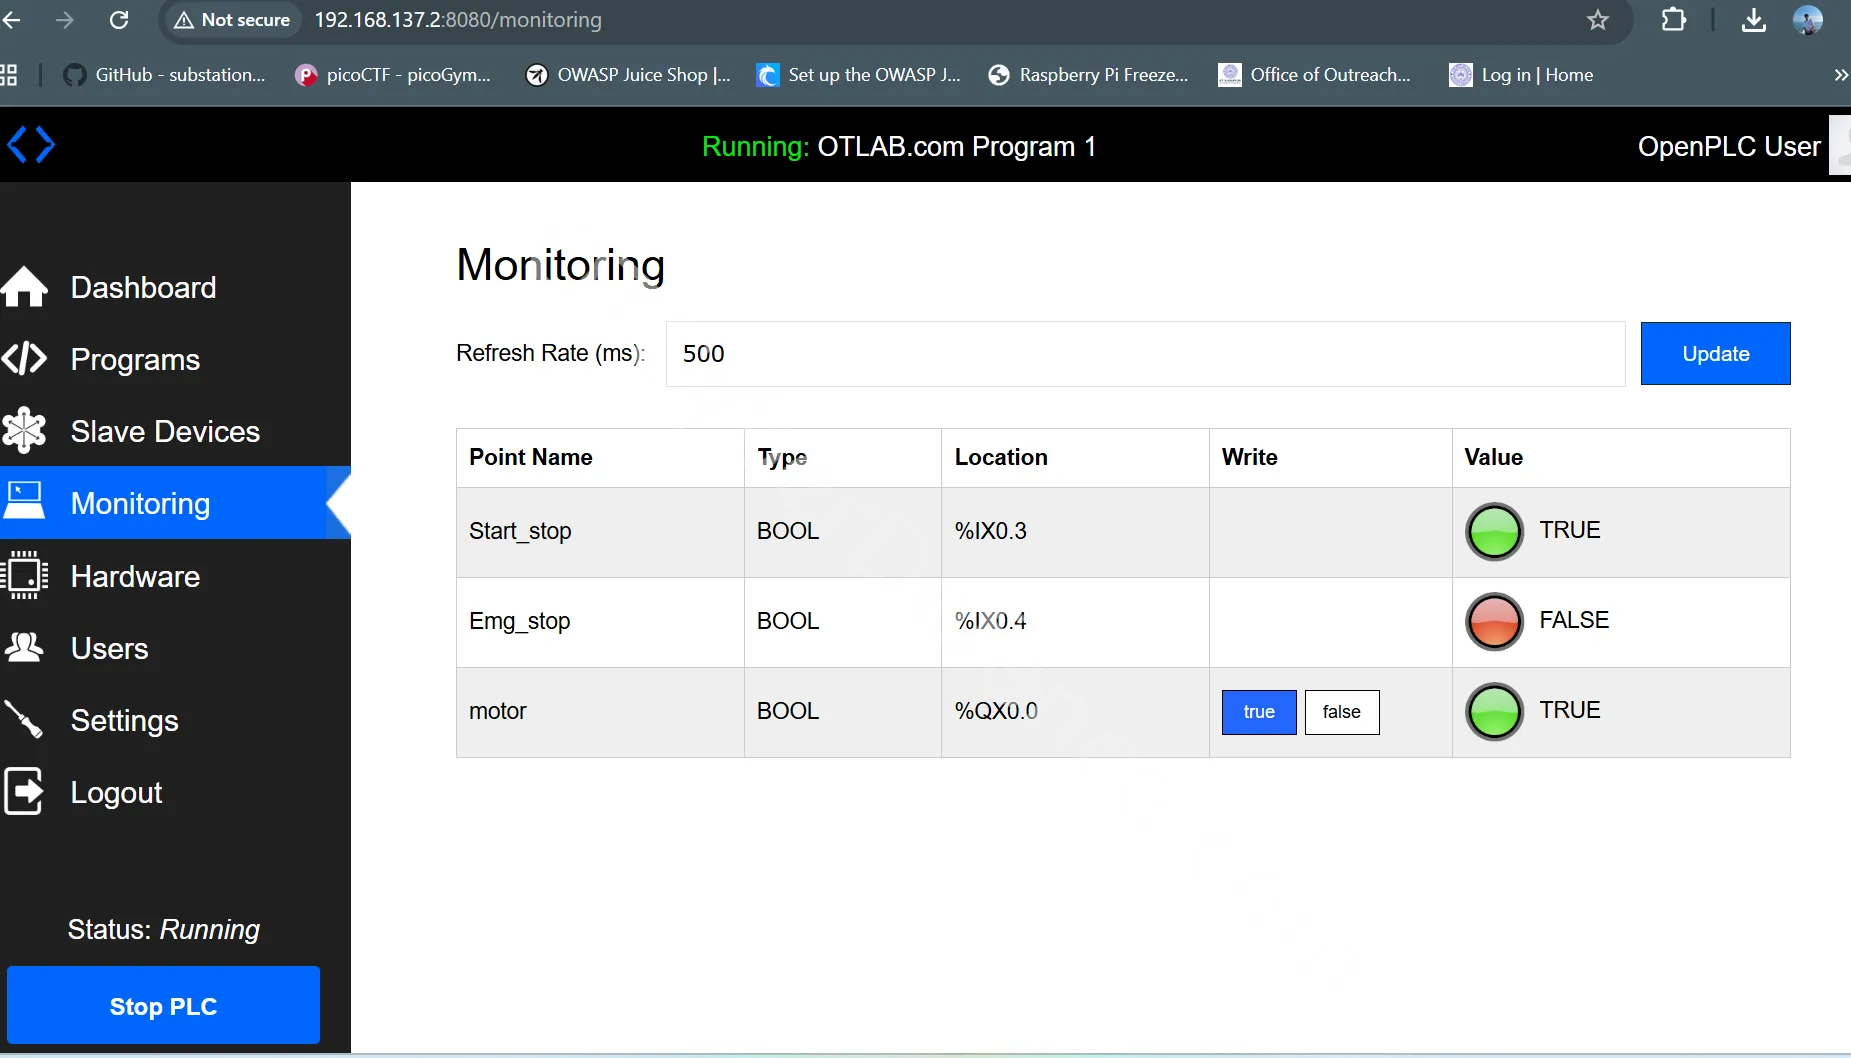
Figure 14: OpenPLC Monitoring page – pushbutton pressed
This was the part I originally wanted when I decided to move away from a completely virtual lab.
I was no longer changing a simulated Boolean value on a screen.
I was pressing an actual switch connected to a GPIO pin, OpenPLC was reading that electrical signal, executing PLC logic and operating a physical output.
10. Connecting ScadaBR to OpenPLC
Next I configured ScadaBR.
The ScadaBR VM was available at: 192.168.137.3
From my Windows machine I opened: http://192.168.137.3:8090/ScadaBR
I created a Modbus TCP data source.
For the PLC connection:
Host: 192.168.137.2
Port: 502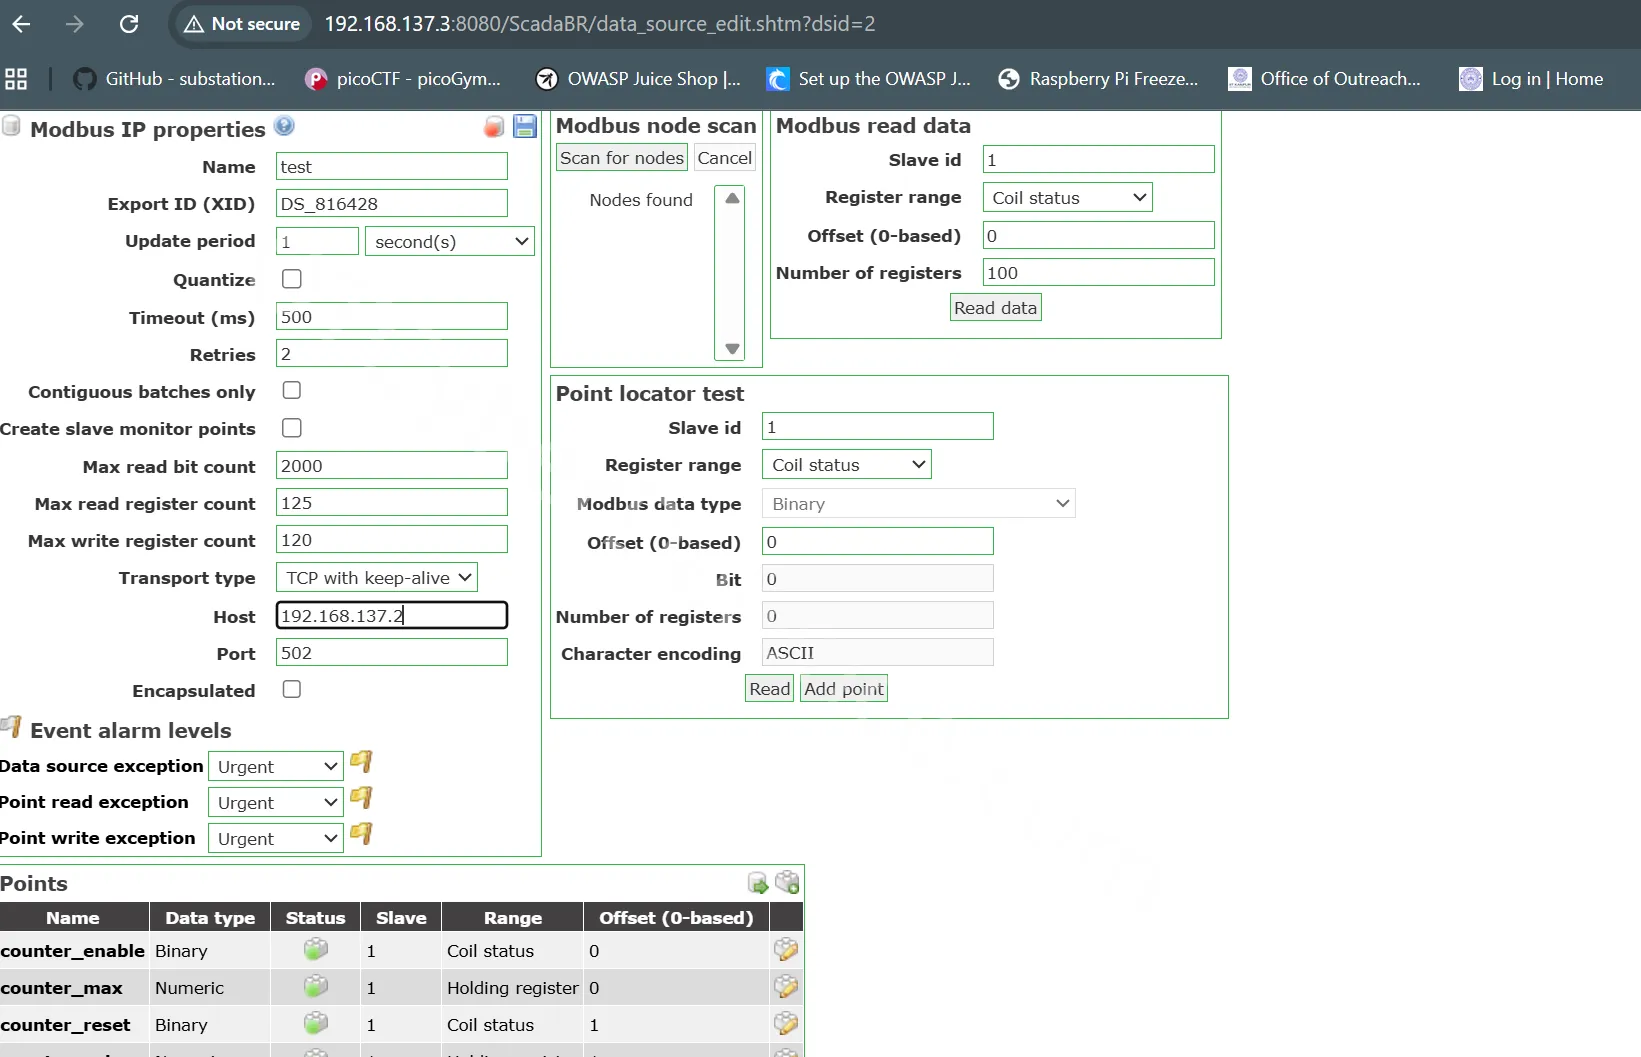
Figure 15: ScadaBR Modbus TCP data source configuration
I then created the required data points corresponding to my PLC values.
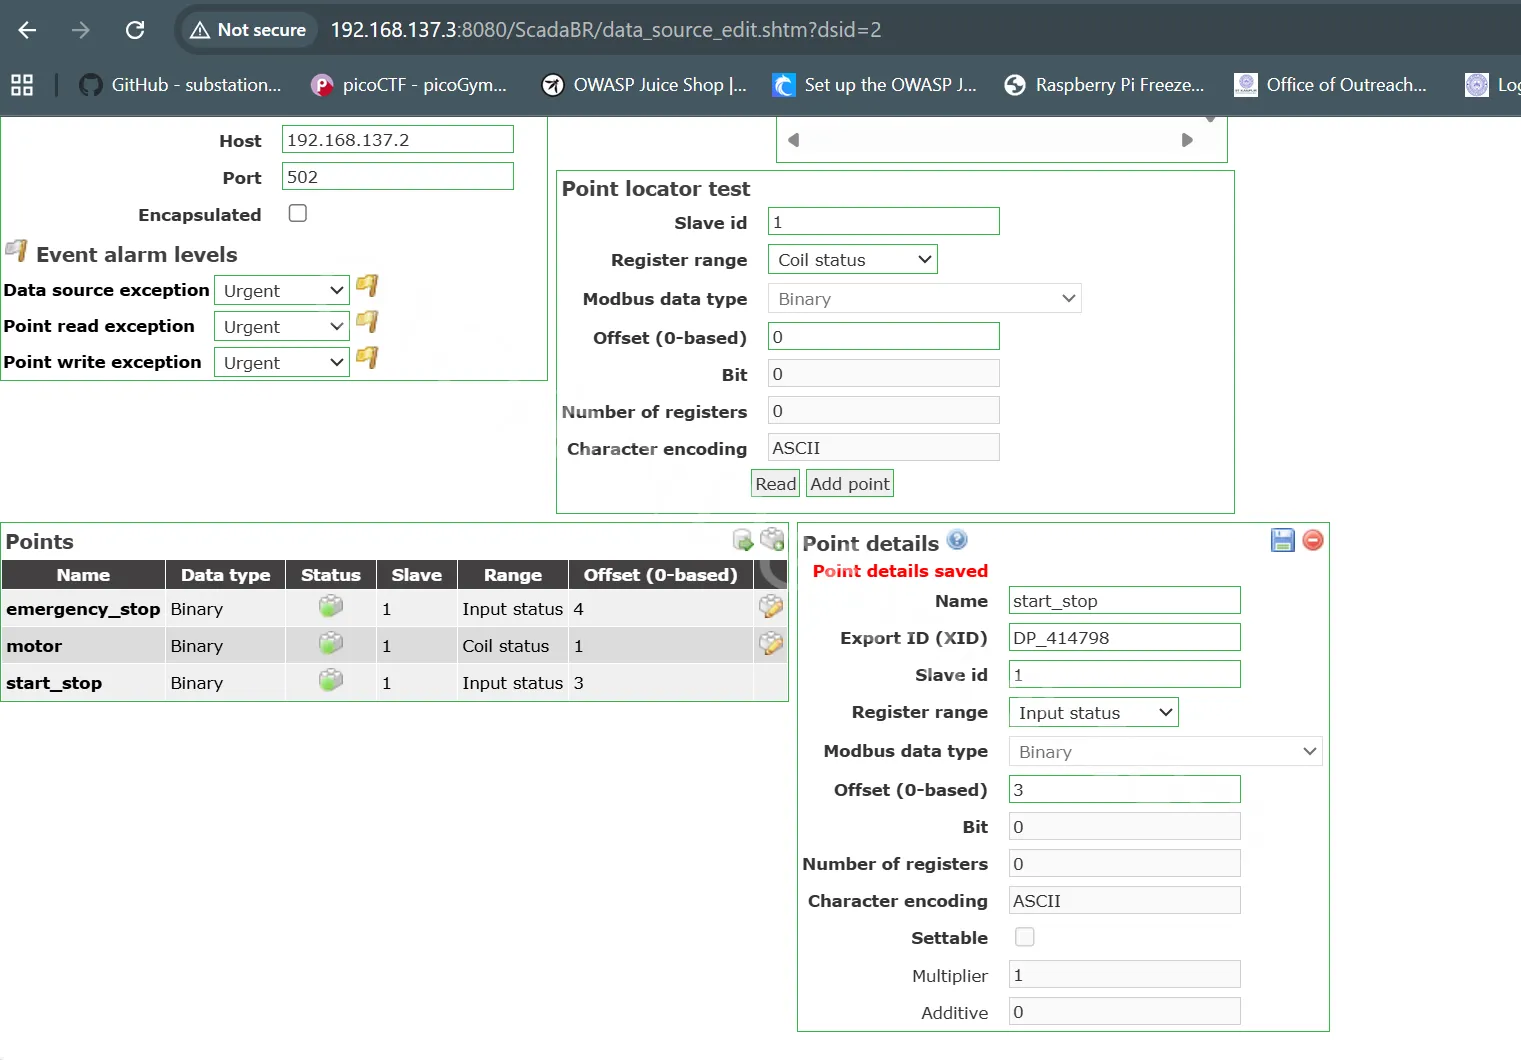
Figure 16: ScadaBR data points
Finally, I created a simple graphical view.
For this experiment I didn’t spend much time making a fancy HMI. I just wanted enough visualization to see the PLC state.
I added simple indicators/buttons for the process.
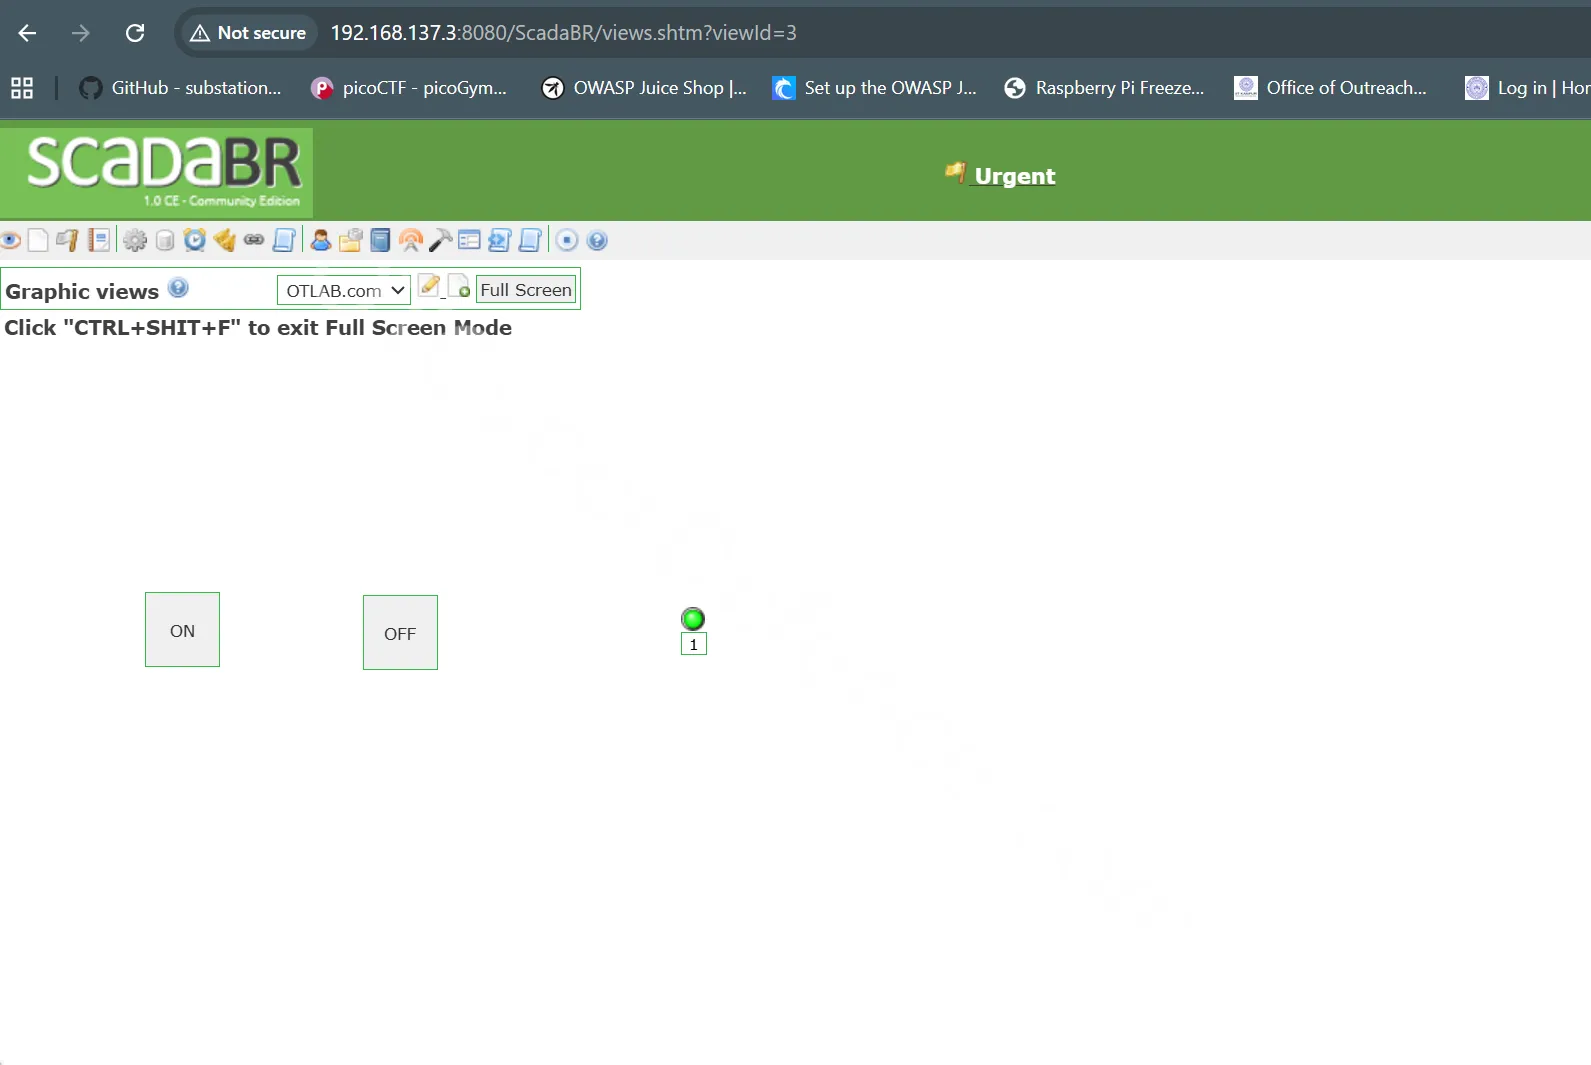
Figure 17: ScadaBR graphical view configuration
Now I could operate the physical input and watch the resulting values in both places: Physical button → OpenPLC → Modbus TCP → ScadaBR
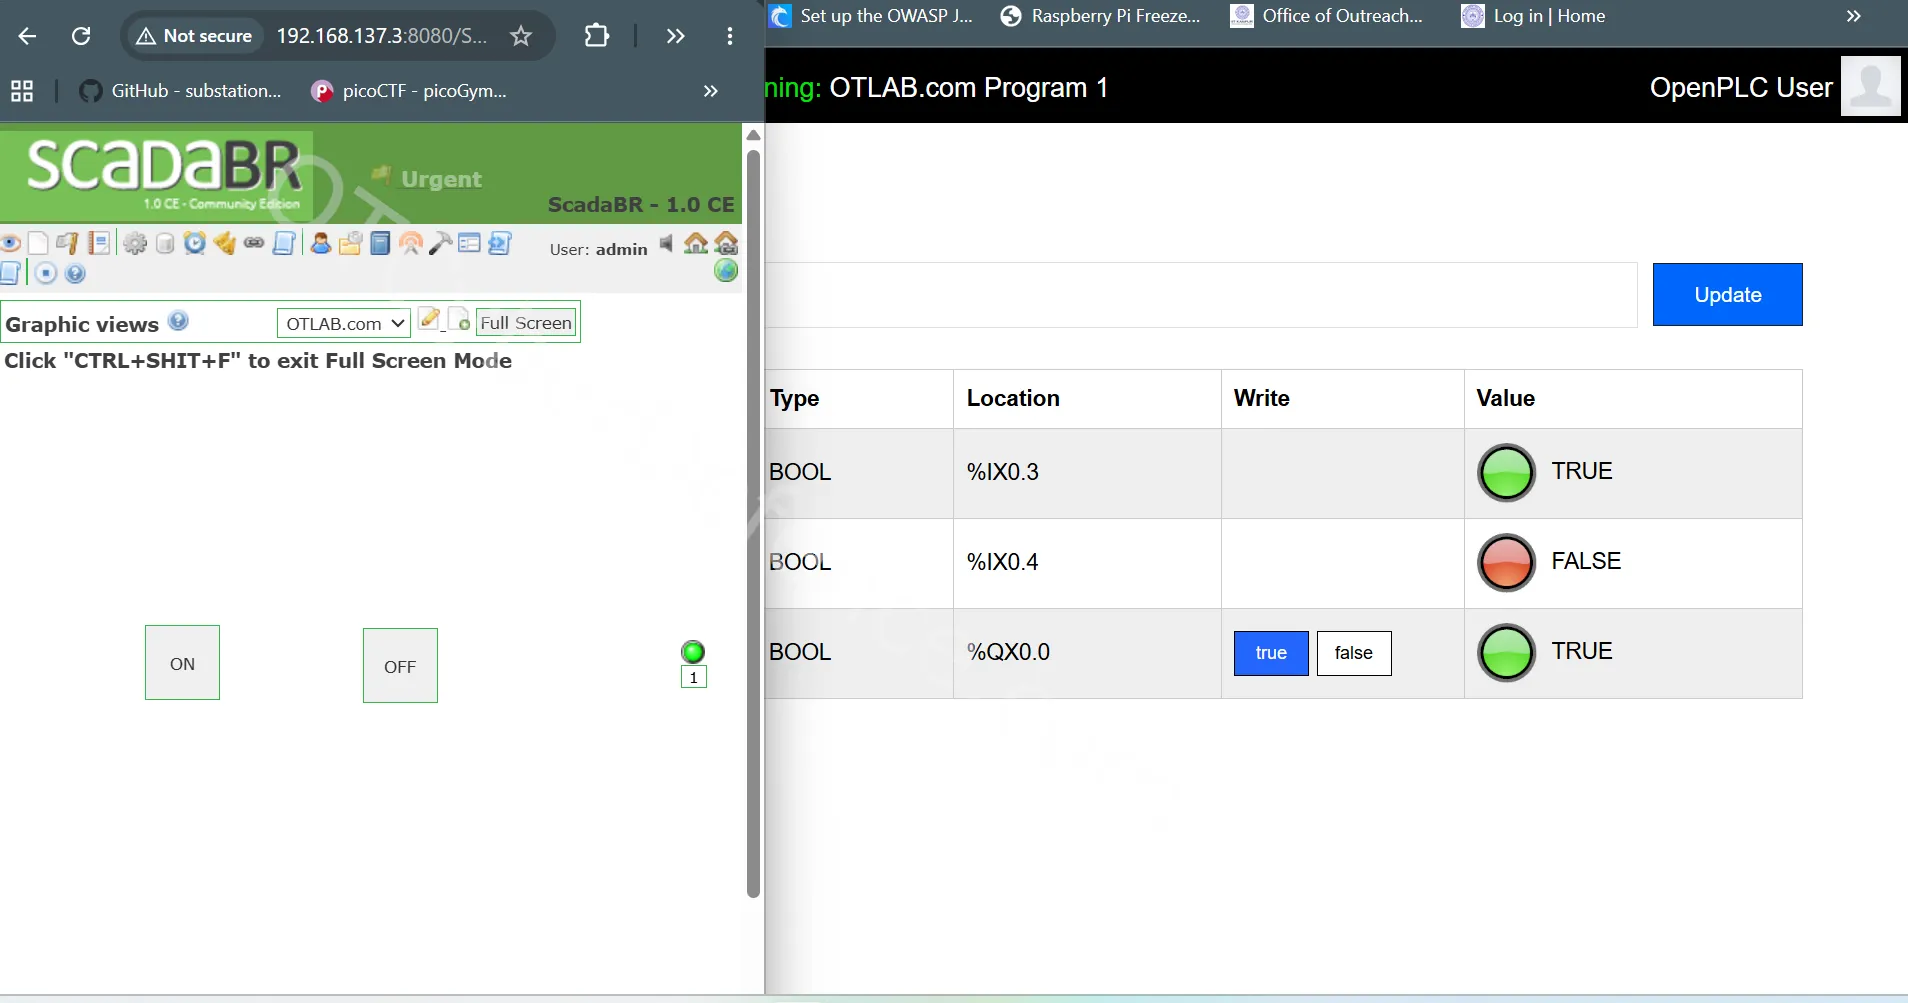
Figure 18: OpenPLC Monitoring and ScadaBR side-by-side
11. Capturing Modbus TCP with Wireshark
Now comes the part that interested me more from an OT-security perspective.
Communication between ScadaBR and OpenPLC uses Modbus TCP.
I opened Wireshark and filtered the traffic using:
tcp.port == 502Immediately I could see communication between:
192.168.137.3 → ScadaBR

192.168.137.2 → OpenPLC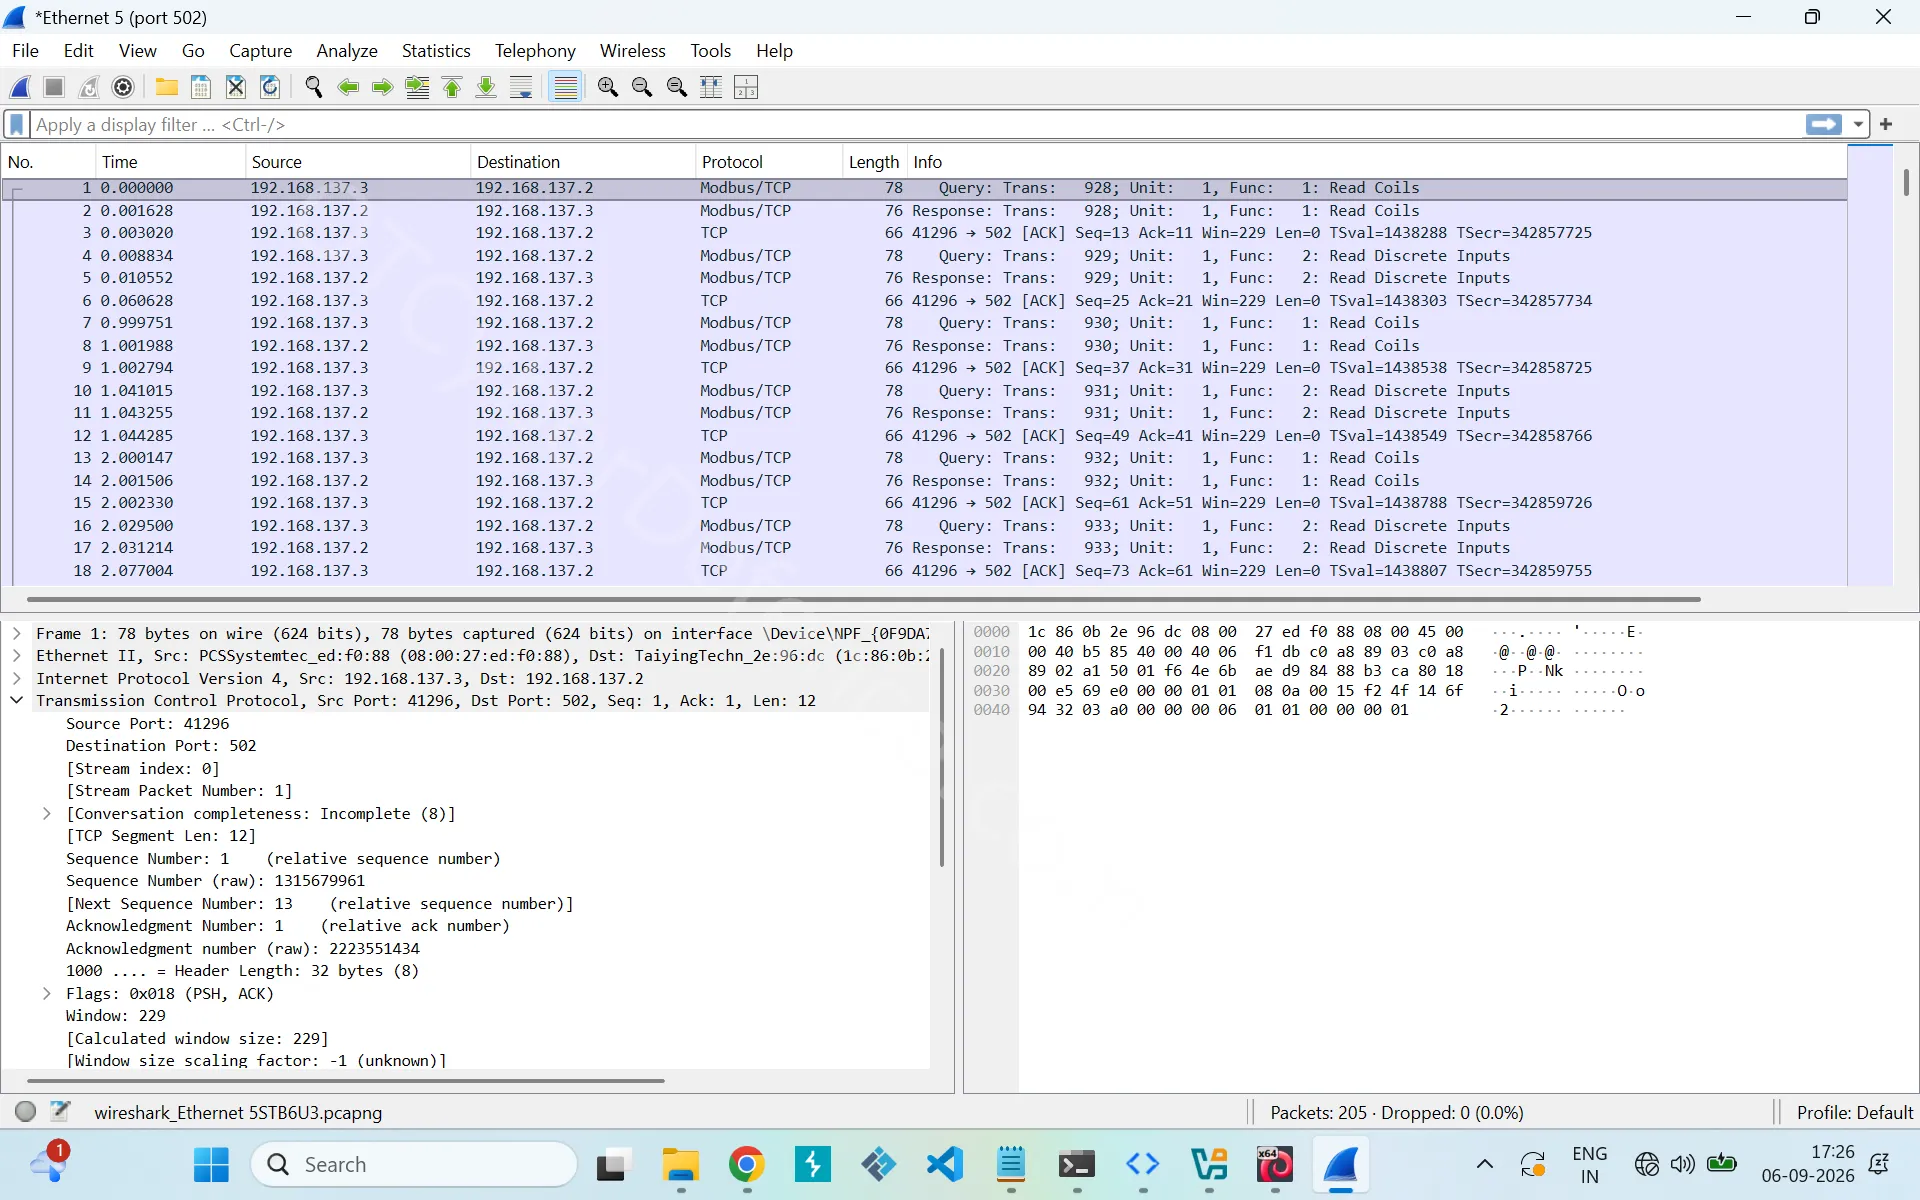
Figure 19: Wireshark showing Modbus TCP traffic
Instead of looking at Modbus only from a PLC programming perspective, Wireshark allows us to see what is actually happening on the network.
We can inspect things such as: Source IP, Destination IP, Function code, Coil/register address, Requested value, Response
And because classic Modbus TCP was not designed with modern authentication and encryption mechanisms built into the protocol, network architecture and access controls become particularly important.
That brings us to Kali.
12. Sending a Modbus Command from Kali
My Kali VM is: 192.168.137.190
It is on the same flat network as the PLC.
For this test I used PyModbus, a Python library that supports Modbus communication.
Install it using:
pip install pymodbusA basic connection to my OpenPLC Runtime looks like:
from pymodbus.client import ModbusTcpClient

client = ModbusTcpClient("192.168.137.2", port=502)

client.connect()
I could then send a write request to a coil used in my test:
client.write_coil(0, 0)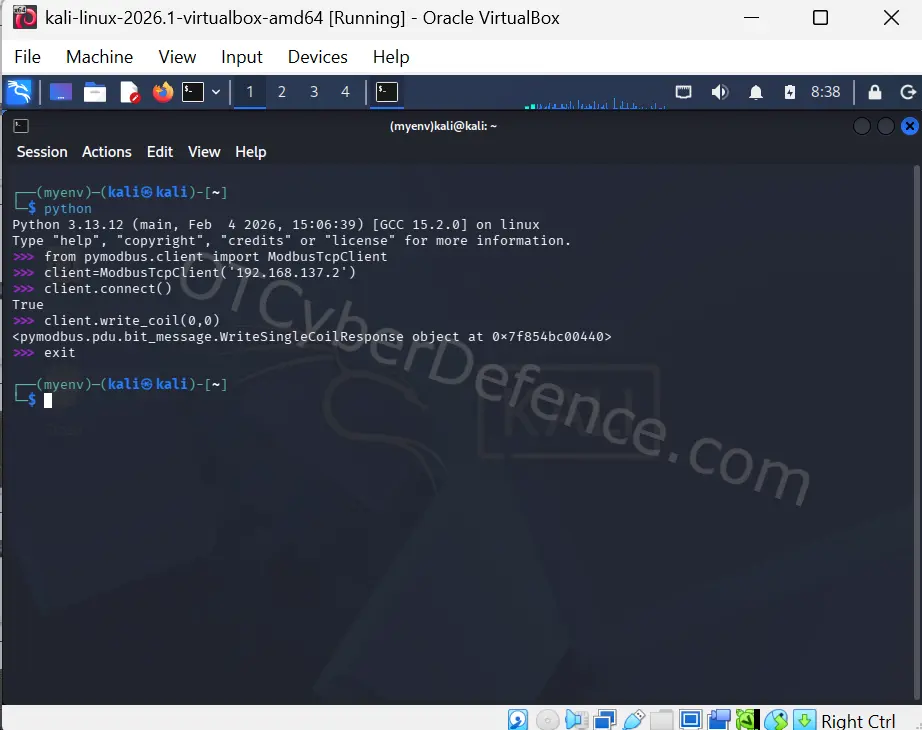
Figure 20: Kali terminal showing PyModbus connection/write
At first, something interesting happened.
I could see that the Modbus write succeeded, but I couldn’t clearly see the output change in OpenPLC Monitoring or ScadaBR.
Wireshark explained why.
13. The Modbus Write Worked – But the PLC Changed It Back
My PLC task was configured with a scan interval of: 20 ms
The PLC program itself was also continuously calculating the motor output.
So the sequence looked roughly like this:
Kali
 │
 │ Modbus Write Coil
 ▼
OpenPLC
 │
 │ %QX0.0 temporarily changes
 ▼
Next PLC Scan
 │
 │ PLC logic executes again
 ▼
%QX0.0 gets calculated again
In other words, my Modbus request could successfully write the value, but the PLC program could overwrite that value again on its next scan.
With a 20 ms PLC task, that happens very quickly.
Meanwhile, my SCADA/monitoring polling was much slower, around hundreds of milliseconds.
So the temporary state might never appear on the SCADA screen.
But it does appear on the network.
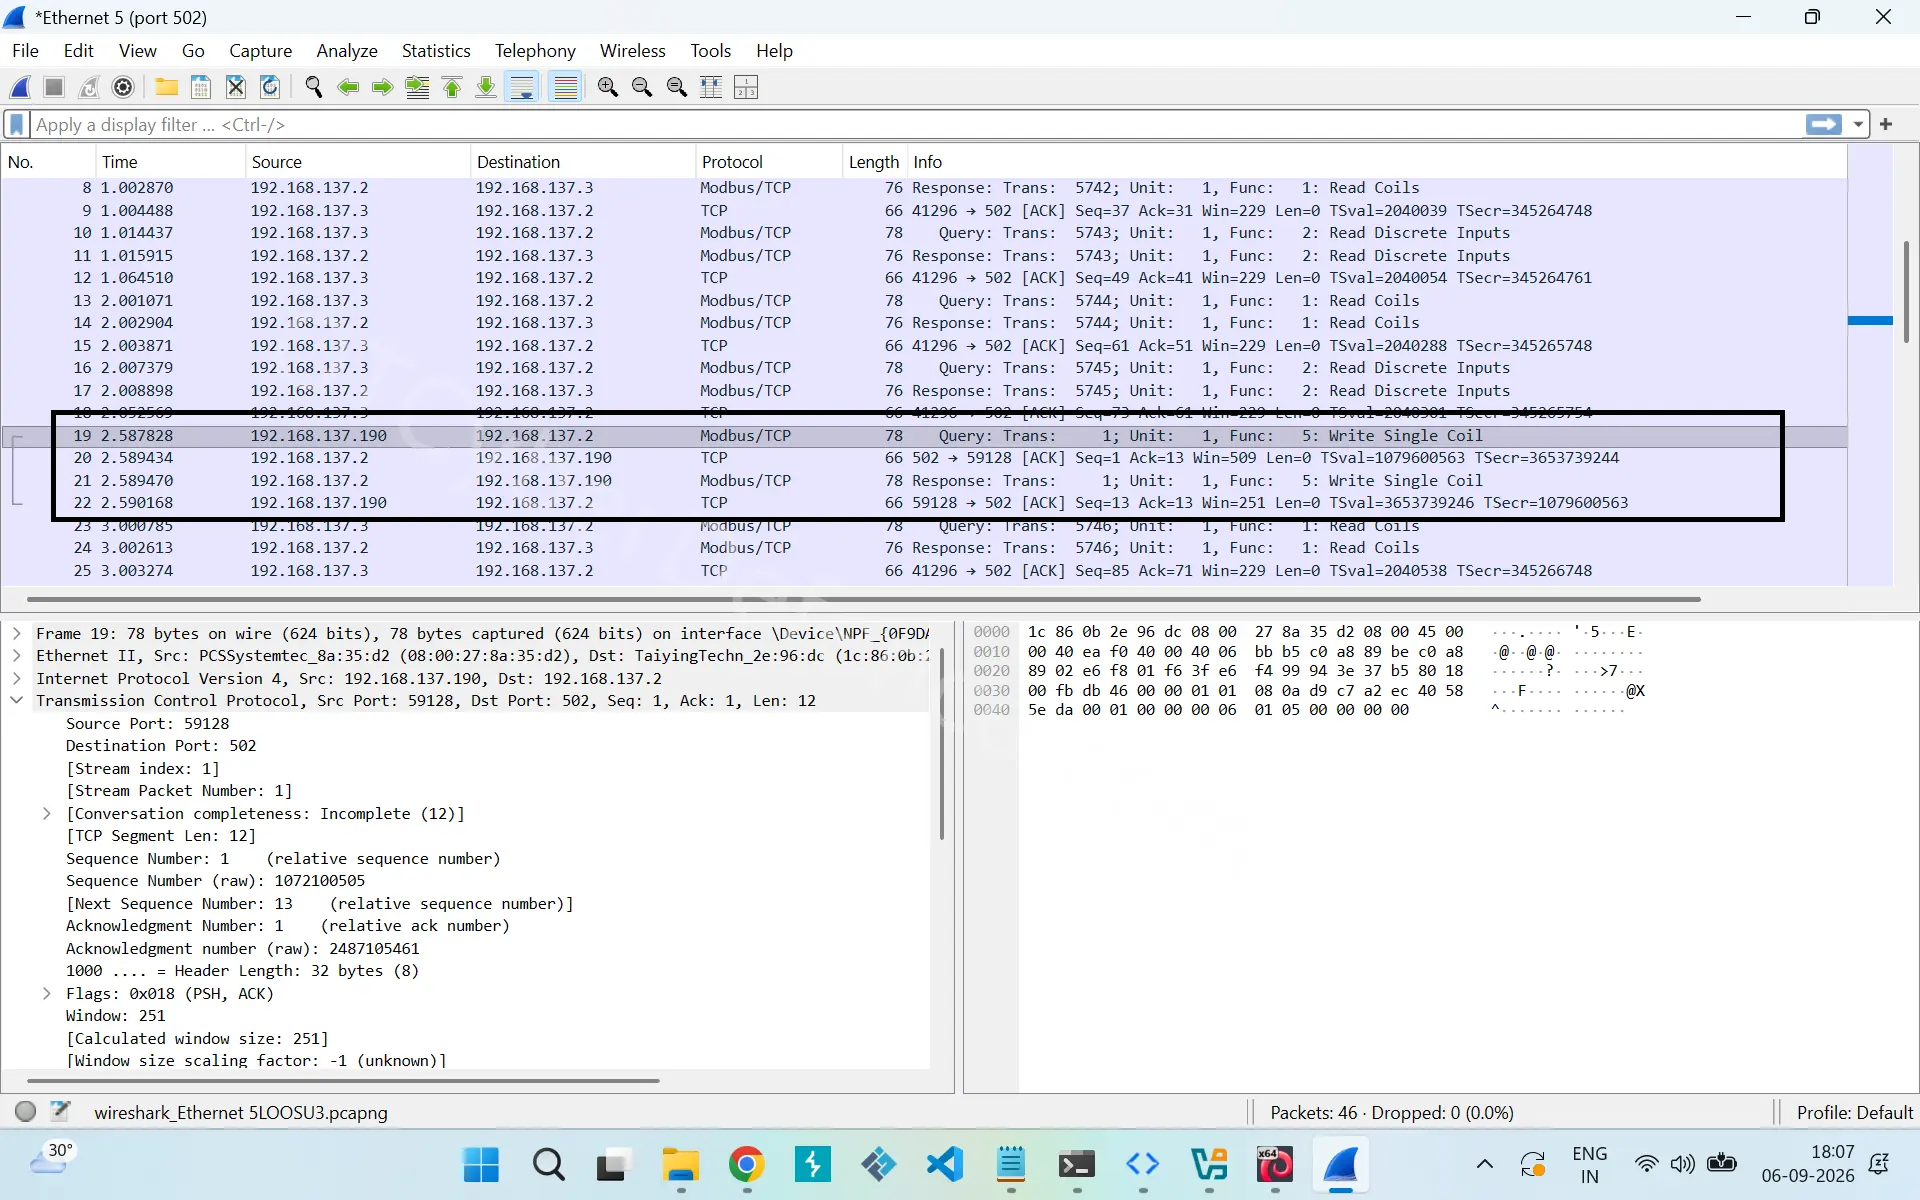
Figure 21: Wireshark showing Write Single Coil request from 192.168.137.190
This is one of the reasons I found packet capture so useful.
I could clearly see:
Source      : 192.168.137.190
Destination : 192.168.137.2
Protocol    : Modbus TCP
Operation   : Write Coil
So even when the process value appeared unchanged from the operator’s point of view, the packet capture showed that another machine had sent a write request to the PLC.
What Did This Simple Lab Teach Me?
This isn’t a complicated industrial control system.
It’s one Raspberry Pi, a few switches, a relay and some virtual machines.
But it gives me a physical environment where I can follow the complete chain:
Physical Signal
      ↓
GPIO
      ↓
PLC Logic
      ↓
Modbus TCP
      ↓
SCADA
      ↓
Network Capture
And from the security side:
Kali
  │
  │ Modbus Write
  ▼
PLC
  │
  ▼
Physical / Logical Output
More importantly, my current architecture has an obvious weakness.
Everything is on the same flat network:
Kali ──────┐
           │
ScadaBR ───┼──── 192.168.137.0/24 ──── OpenPLC
           │
Laptop ────┘
Kali can directly reach the PLC’s Modbus TCP service.
There is currently no network-security control between them.
And that’s intentional.
I wanted to first build the insecure version and understand how the communication actually works before adding security controls.
What’s Next?
The next step is to start securing this lab.
Instead of keeping everything on one flat network, I want to separate the environment into different zones, for example:
              Firewall / Router
                     │
        ┌────────────┼────────────┐
        │            │            │
     CONTROL        SCADA       SECURITY
      VLAN           VLAN         VLAN
        │            │            │
     OpenPLC       ScadaBR       Kali
Then I can define exactly which systems should be allowed to communicate with the PLC and over which protocols.
For example, ScadaBR may legitimately need:
ScadaBR → OpenPLC → TCP/502But does the Kali/testing workstation need unrestricted access to the PLC?
Probably not.
That will let me move from simply observing and manipulating OT communication toward the more important question:
How do we design the network so that only the communication required for the industrial process is allowed?
That’s what I’ll explore as I continue building this lab.
Disclaimer: This lab is intended for learning and testing on equipment and networks I own and control. The same testing should not be performed against production or third-party OT systems without authorization.